
Cfljam
John McCallum
Recently Published
Plot Tristimulus Colorimetry Data with Colorspace
How to plot points with colors mapped to their LAB colors

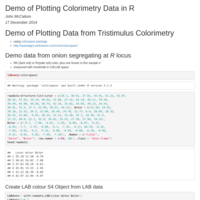
Plotting Colorimetry Data with R
How to plot data from tristimulus colorimetry in R using colorspace package to allow approximate mapping of point color to instrumental color

Reading Data Logger CSV files into Postgres Using RPostgreSQL
testing storage or raw data logger output using RPostgreSQL

Analysing Onion SSR Data with AdeGenet
Example of AdeGenet Usage with microsatellite data .
See http://link.springer.com/article/10.1007%2Fs11032-012-9727-6
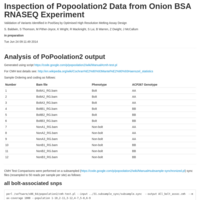
Supplementary File 1 : BSA RNASEQ analysis
Filtering of Onion Bulked Segregant RNASEQ leads from Popoolation2