
DmiProps
Dmitriy Yakovlev
Recently Published
Mtcars k-means clustering
This assignment has two parts:
1. First, you will create a Shiny application and deploy it on Rstudio's servers.
2. Second, you will use Slidify or Rstudio Presenter to prepare a reproducible pitch presentation about your application.

R Markdown Presentation & Plotly
Create a web page presentation using R Markdown that features a plot created with Plotly. The webpage must contain the date that you created the document, and it must contain a plot created with Plotly.
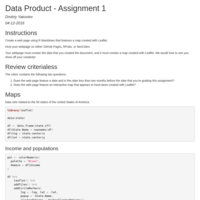
Data Product - Assignment 1
Create a web page using R Markdown that features a map created with Leaflet.
Host your webpage on either GitHub Pages, RPubs, or NeoCities.
Your webpage must contain the date that you created the document, and it must contain a map created with Leaflet. We would love to see you show off your creativity!
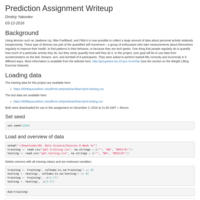
Prediction Assignment Writeup
Using devices such as Jawbone Up, Nike FuelBand, and Fitbit it is now possible to collect a large amount of data about personal activity relatively inexpensively. These type of devices are part of the quantified self movement – a group of enthusiasts who take measurements about themselves regularly to improve their health, to find patterns in their behavior, or because they are tech geeks. One thing that people regularly do is quantify how much of a particular activity they do, but they rarely quantify how well they do it. In this project, your goal will be to use data from accelerometers on the belt, forearm, arm, and dumbell of 6 participants. They were asked to perform barbell lifts correctly and incorrectly in 5 different ways. More information is available from the website here: http://groupware.les.inf.puc-rio.br/har (see the section on the Weight Lifting Exercise Dataset).
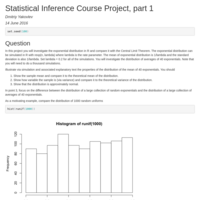
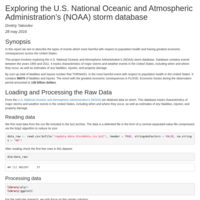
Exploring the NOAA Storm Database
Exploring the U.S. National Oceanic and Atmospheric Administration's (NOAA) storm database