
JLB
Julio Lahoz
Recently Published
exploratory
In this analysis I aim to discern which meteorological/geological events were the most harmful to public health and economy between the years 2001 and 2010 in the USA. To perform this analysis I used data from the U.S. National Oceanic and Atmospheric Administration's (NOAA) storm database.
Correct exercise technique can be predicted from wearable data
When it comes to work out, many people count the repetitions they do but less attention is given to the quality of the technique, 1. Here I aim to discern whether it is possible to discriminate between a good and a mediocre technique. Data from accelerometers on the belt, forearm, arm, and dumbell of 6 participants was used (data source:http://groupware.les.inf.puc-rio.br/har).
Individuals were asked to do barbell lifts correctly, and incorrectly in 4 different ways.

Destructive quakes detected on earth (from 1951 to 2016)
Curious about where the most destructive earthquakes have happened between the years 1951 and 2016? - This app shows the exact date, magnitude, and location of quakes per region and year. - It also provides the total number of destructive earthquakes registered per region and year.
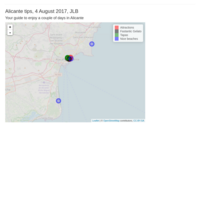
Alicante 2017 tips
Your guide to enjoy a couple of days in Alicante
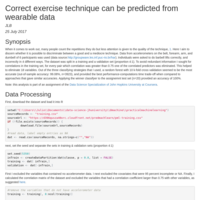
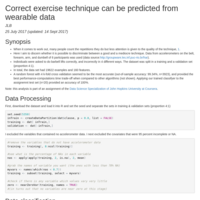
Correct exercise technique can be predicted from wearable data
When it comes to work out, many people count the repetitions they do but less attention is given to the quality of the technique. Here I aim to discern whether it is possible to discriminate between a good and a mediocre technique. Data from accelerometers on the belt, forearm, arm, and dumbell of 6 participants was used (data source: http://groupware.les.inf.puc-rio.br/har). Individuals were asked to do barbell lifts correctly, and incorrectly in 4 different ways. The dataset was split in a training and a validation set (proportion 4:1). To avoid redundant information I sought for correlations in the training set, for every pair which correlation was greater than 0.75 one of the correlated predictors was eliminated. This helped to eliminate 18 variables. Out of the three classifying strategies that I used, a random forest with 10 k-fold cross validation seemed to be the most accurate (out-of-sample accuracy: 99.08%, n=3923), and provided the best performance-computations time trade-off when compared to approaches that gave similar accuracies. Applying the winner classifyer to the assignemnt test set (n=20) provided an accuracy of 100%.
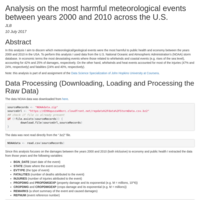
Analysis on the most harmful meteorological events between years 2000 and 2010 across the U.S.
In this analysis I aim to discern which meteorological/geological events were the most harmful to public health and economy between the years 2000 and 2010 in the USA. To perform this analysis I used data from the U.S. National Oceanic and Atmospheric Administration’s (NOAA) storm database. In economic terms the most devastating events where those related to whirlwinds and coastal events (e.g. rises of the sea level), accounting for 42% and 25% of damages, respectively. On the other hand, whirlwinds and heat events accounted for most of the injuries (47% and 24%, respectively) and fatalities (24% and 40%, respectively).