
J_Tamez
Jose Gerardo Tamez Pena
Recently Published

ILAA
Handling multicollinearity with ILAA.
Impact on Linear and Logistic Regression Modeling are provided
#Multicollinearity, #Decorrelation, #LinearTransformations #ERT

70SignatureEvaluation
Evaluation of the 70 Gene Signature based on the data from the "vanDeVijver" validation dataset.
RRPlots and Survival Biomarkers
How to use the FRESA.CAD RRPlot() function to validate and evaluate Survival Biomarkers

RRPlots for Survival Model Evaluations
Sample code for the use of RRPlots for the evaluation of Survival Models
DARWIN: Alzheimer's Diagnosis and Feature Decorrelation
Testing the feature decorrelation algorithm on the DARWIN data set
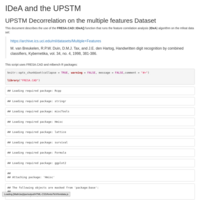
Multiple Features and the FDeA
Demo of the use of Feature Decorrelation on the multiple Feature Data set.
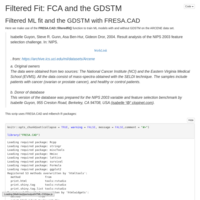
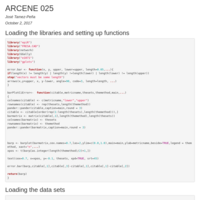
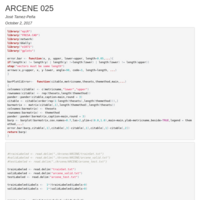
GDSTM and ARCENE
Testing the Feature Decorrelation Algorithm, the Filtered Fit on the Arcene Data Set.
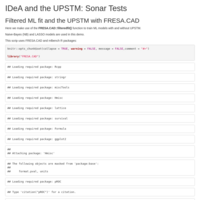
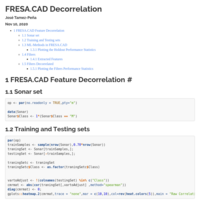
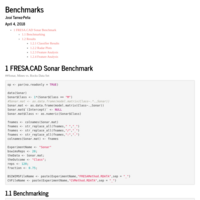
GDSTM Machine Learning on the Sonar Data Set
A demo of the use of filteredfit() to train and validate Machine Learning models with data decorrelation
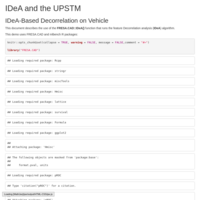
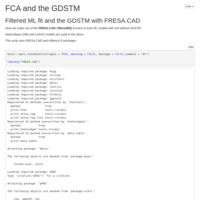
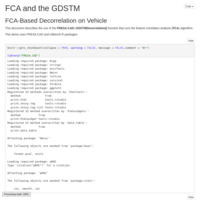
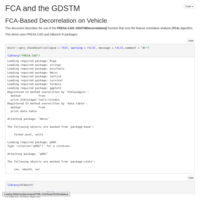
FDeA and Machine Learning on the Vehicle data set
A demo showcasing options to compute the decorrelation matrices on the Vehicle data set.
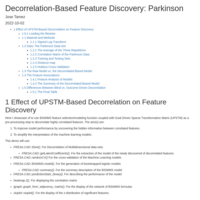
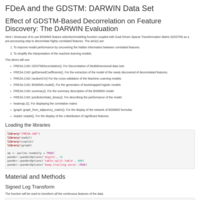
Feature Discovery and Decorrelation
The Discovery of Features associated with an outcome is enhanced by data transformations that simplify the machine learning process
FCA and the GDSTM: ARCENE
Filtered Fit GDSTM on Arcene Data Set
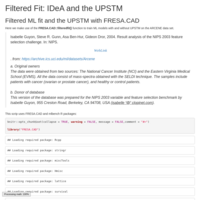
Filtered Fit of ML and the decorrelation
Tutorial of Filteredfit() function with decorrelation
FCA and the GDSTM: Tutorial
Full description of the GDSTMDecorrelation function of FRESA.CAD
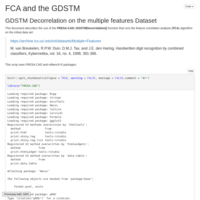
FCA and the GDSTM: Multiple Features
Sample use of GDSTMDecorrelation
FCA and the GDSTM
Demo of FRESA.CAD::GDSTMDecorrelation()
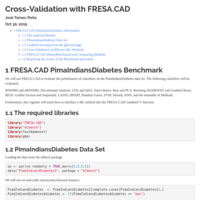
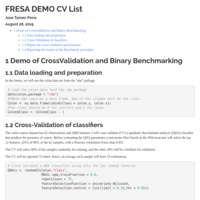
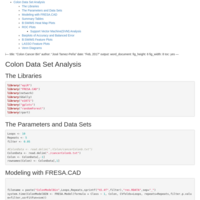
Colon Cancer FRESA.CAD Cross-Validation
Vignette of Cross-Validation using FRESA.CAD

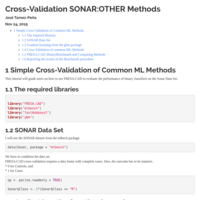
SONAR data set and CARET Methods
Testing FRESA.CAD 3.3.0 f
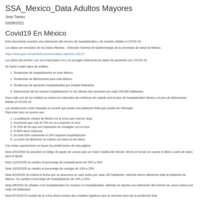
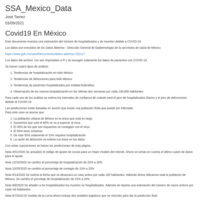
COVID-19 Mexico Adultos Mayores
Hospitalizaciones y Defunciones de adultos Mayores (>60) en México por
COVID-19
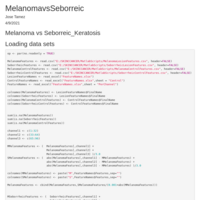
Melanoma vs Seborrheic Diagnosis
Radiomics and Melanoma Diagnosis
Parkisons and Decorrelation
Testing Feature Decorrelation on the Parkisons Data Set
ARCENE decorration and Two Set Cross-Validation
Testing the effect of feature decorrelation on the ARCENE daata set
FRESA.CAD Feature Decorrelation (pseudo whitening)
Here is an example of the options of the targeted feature decorrelation function in FRESA.CAD.
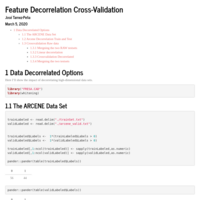
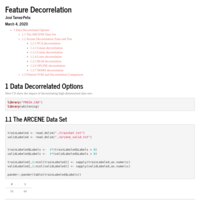
Feature decorrelation ARCENE
Multidimensional data decorrelation.
Here I show the advantage of non-ortogonal decorrelation of multidimensional signals.
Top basis vectors are sequentially drawn from the data matrix, features are decorrelated creating a new set of non-correlated features.
FRESA.CAD ML Methods and Filters and Decorrelation
Classifier ML methods in FRESA.CAD.
Various ML methods, with filters and feature decorrelation
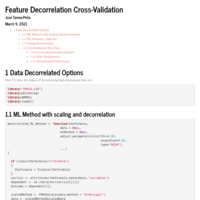
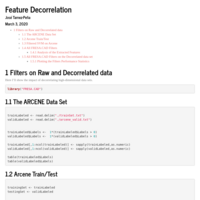
Feature decorrelation
Impact of Feature Decorrelation on ML methods
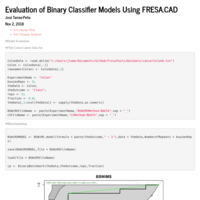
FRESA.CAD ML Methods and Filters
Running all the FRESA.CAD modeling functions and filter for Binary Outcomes
BSWiMS,KNN,NB,PCA,Signature,LASSO,BESS, etc...
COVID-19 Mexico
Mexico COVID
COVID-19 Country Peaks
Country Peaks Estimations of COVID-19
COVID19Mexico
Predictions of New Hospitalizations and Fatalities in Mexico
COVID-19 Patient Survival
Estimating the probability of Discharge from Hospital
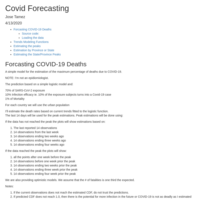
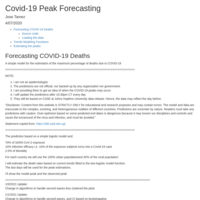
COVID-19 Forcasting
Forecasting the expected % of deaths due to COVID-19
I'm not an epidemiologist so don´t believe 100% of the estimations.
Models where updated 4/8/2020 with 4/7/2020 data from Kaggle
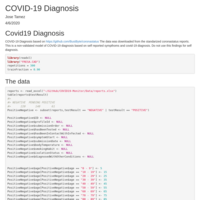
COVID-19 Diagnosis based on Self Reported Symptoms (coronastatus)
Ensemble Model of Logit functions for the diagnosis of COVID-19.
The model is not valid. It is just a proof of concept of ML for the diagnosis of COVID-19 based on self-reported symptoms and diagnosis
COVID-19 Probability of Hospital Discharge Based on Symptoms
Estimating the probability of Hospital Discharge based on Patient Symptoms
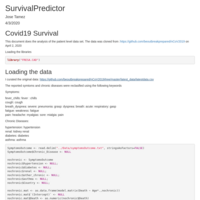
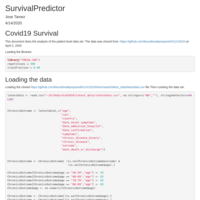
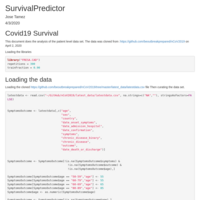
COVID-19 Survival Prediction
Models and features that predict death from COVID-19. Diabetes, hypertension, and dyspnea.
Caret and FRESA.CAD
Benchmarking Caret-optimized classifiers with FRESA.CAD
SONAR FRESA.CAD
Testing Boosting with FRESA.CAD
ADA boost, Gradient Boost, RF, LDA, QDA, KNN, KNN-BSWiMS
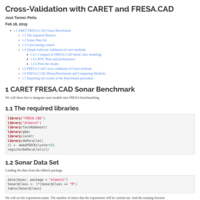
Cross-Validation Tutorial with FRESA.CAD
Gradient Boost, Ada Boost, KNN, Random Forest, LASSO, SVM, LDA, QDA, Logistic Regression, RPART.
Blanced, Proportional, Boostraping Cross-Validation
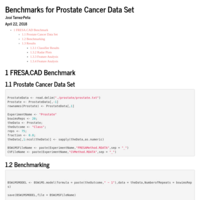
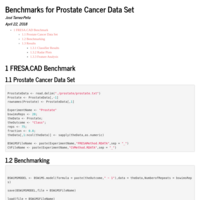
Prostate Cancer
FRESA.CAD Benchmarking the prostate cancer data set
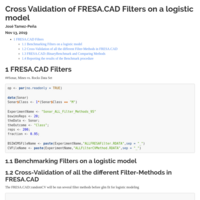
FRESA.CAD Filters
Evaluation of Filters on a Logistic Regression Fit: IDI,NRI,Kendall, T-test,wilcoxon, etc....
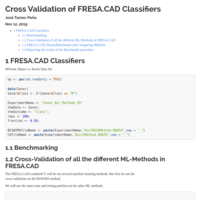
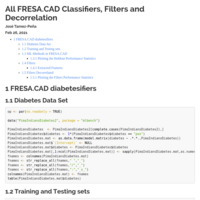
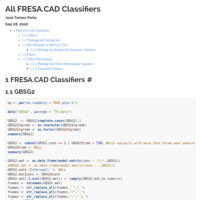
All FRESA.CAD Classifiers
Classifiers that have FRESA.CAD interface for random cross-validation
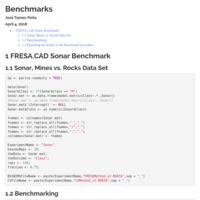
Benchmark Sonar
FRESA.CAD Benchmarking
Bootstrap Validation ML Methods with FRESA.CAD
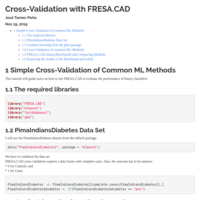
Comparing several ML methods on the DIABETES dataset

Repeated_Cross_Validation
The use of FRESA.CAD Cross-validation function and FRESA.CAD binary benchmark to compare ML methods.
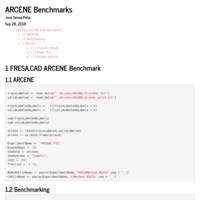
ARCENE Update
Binary Classification Benchmarking with the ARCENE dataset
ADABOOST Comparison
Comparing ADABOOST vs Other Common classifiers
Comparing Binary Classifications
Ada Boost and Hybrid Learning with FRESA.CAD benchmark
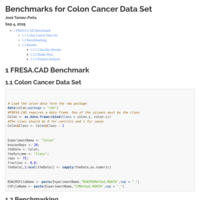
Colon Cancer Update
Benchmarking Classifiers
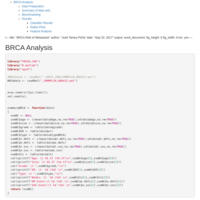
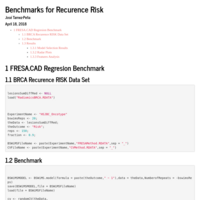
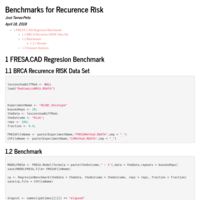
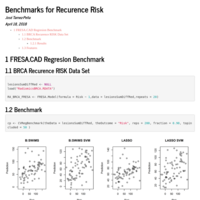
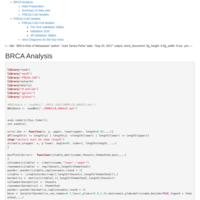
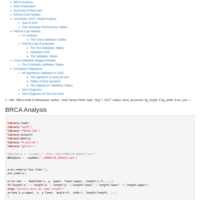
BRCA Recurence Signatures
Genes associated with BRCA recurrence
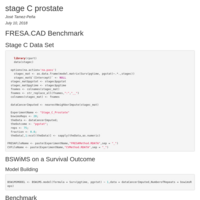
Stage C Prostate Cancer
FRESA.CAD benchmark on stagec prostate cancer data set
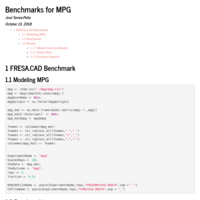
MPG
FRESA.CAD on Milles per Galon Dataset
White_wine_Quality
FRESA.CAD benchmarking Classification models on the White Wine Dataset
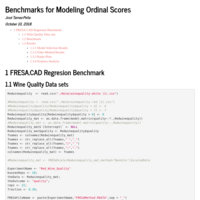
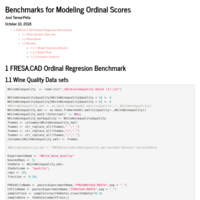
Wine Quality
Benchmarking Ordinal Algorithms using FRESA.CAD
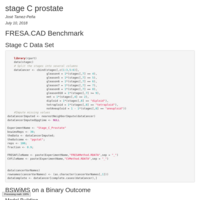
FRESA.CAD Stage C Prostate Cancer
Use of the benchmark function for the evaluation of classification algorithms.

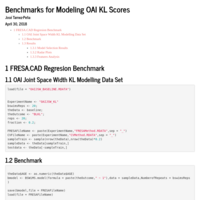
Ordinal OA KL Scores
Predicting KL Scores using quantitative JSW OAI measurements
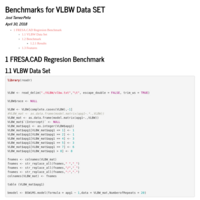
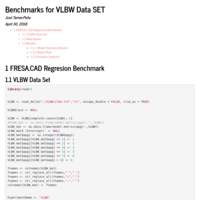
VLBW and FRESA.CAD
Ordinal Modeling of the Low Birth Weight data set
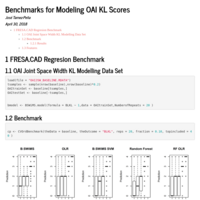
OA KL Modeling
KL Score modeling with FRESA.CAD
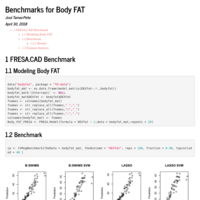
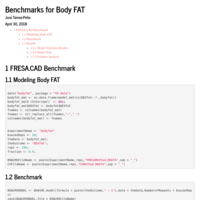
Body Fat
DEXA Body Fat estimation from anthropometric measurement
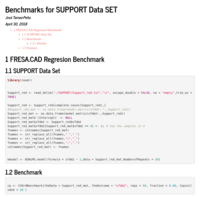
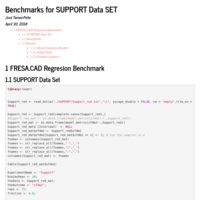
SUPPORT
"Data obtained from http://biostat.mc.vanderbilt.edu/DataSets".
Prostate Benchmark
Benchmarking B:SWiMS, LASSO, SVM, RF
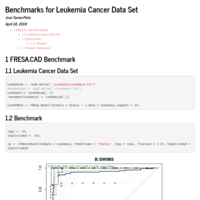
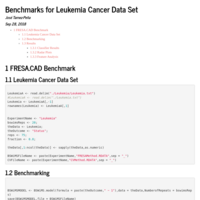
Leukemia Benchmark
Benchmark of classifiers and Feature Selection: B:SWiMS, LASSO, Random Forest and SVM with FeaLect
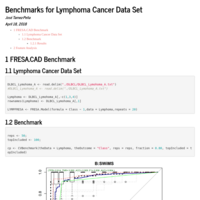
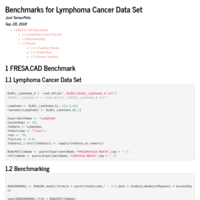
Lymphoma Benckmark
Lymphoma Benchmark with B:SWiMS, SVM, RF and SVM
Radiomics BRCA: Mammogram-based ONCOTYPE Risk prediction
Prediction of ONCOTYPE DX from Radiomics Analysis of Mammograms
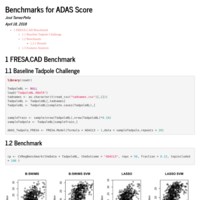
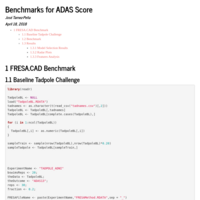
Alzheimer´s ADAS prediction
Predicting ADAS13 from MRI's Structural quantitative analysis
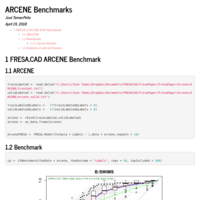
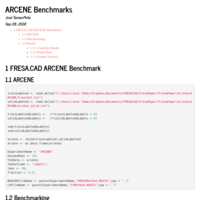
ARCENE Benchmark
FRESA.CAD´s B:SWiMS approach is compared to SVM, RF and LASSO on the ARCENE data set
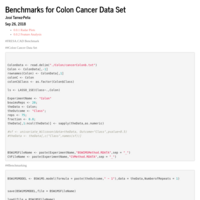
Colon FRESA.CAD
Colon Benchmark: BSWIMS,SVM,LASSO and RF
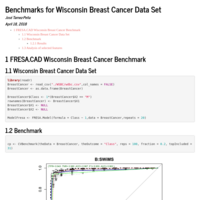
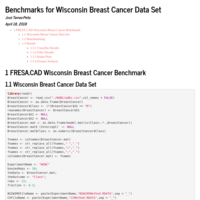
Wisconsin Breast Cancer Data Set
Wisconsin Breast Cancer Data Set analysis using FRESA.CAD
Comparison between LASSO, Random Forest, Support Vector Machine (SVM),
and the use of FeaLect for feature selection.
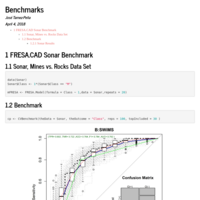
Sonar Data Set Analysis with FRESA.CAD
Benchmarking FRESA.CAD with the SONAR data set.
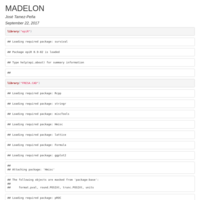
MADELON
FRESA.CAD Madelon and SVM
FRESA.CAD tutorial
Example of the use of FRESA.CAD to find and analyze models
ARCENE
FRESA:CAD on the ARCENE data set
BRCA Recurrence with Logit Models and Correlation Signatures
Risk Models of Breast Cancer Recurrence using FRESA.CAD
Breast Cancer: Lung metastases
Predicting Survival
BRCA Logit
BRCA recurrence with logistic models
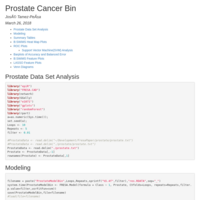
Prostate Cancer FRESA:CAD
Analysis of the prostate cancer DB
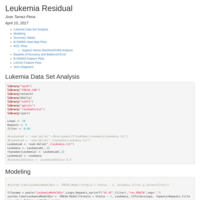
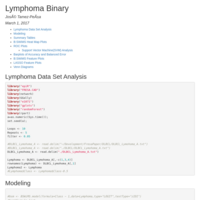
Lymphoma FRESA.CAD
BSWIMS test on lymphoma data set

OA Outcomes Models
Prediction of KL scores and TKR using X-Ray Quantitative Image assessments Data form OAI
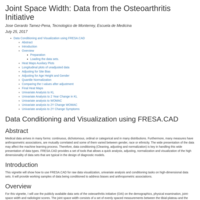
Adjusting Longitudinal Data: Data from the OAI
This document shows how to adjust longitudinal data to site bias and anthropometric differences
Breast Cancer Signatures
Scrip showing the use of FRESA.CAD for the creation and validation of breast cancer signatures