
black_tank_top
Takatsugu KOSUGI
Recently Published
hplot
a <-hPlot(Pulse ~ Height, data = MASS::survey, type = "scatter", group = "Exer")
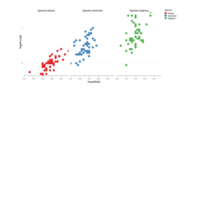
rCharts_rPlot_iris
names(iris) = gsub("\\.", "", names(iris))
r1 <- rPlot(SepalLength ~ SepalWidth | Species, data = iris,
color = 'Species', type = 'point')
#r1$publish('Scatterplot', host = 'gist')
r1$publish('Scatterplot', host = 'rpubs')