doandang
doan
Recently Published
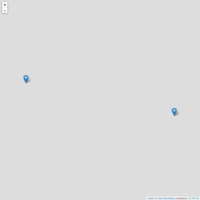
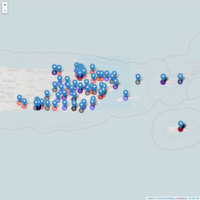
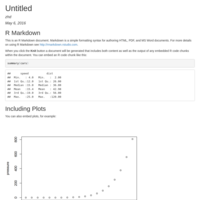
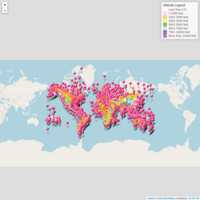
Longitude and latitude with leaflet
data(usdata)
RdYlBu = colorFactor("RdYlBu")
m <- leaflet(data = usdata[50:150,]) %>% addTiles() %>%
addMarkers(~longitude, ~latitude, popup = ~as.character(city), label = ~as.character(state))
m %>% addCircleMarkers(color = c('red','blue','black'))
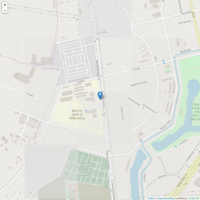

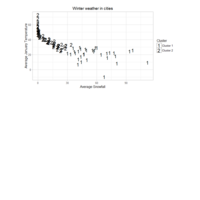
CLUSTERING CITIES
This data set has the average temperature in January, average snowfall, and average precipitation of 98 cities in the U.S. We will cluster them to see which cities have similar winter climates.
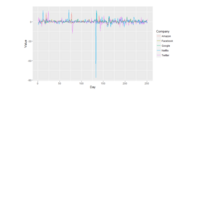
Publish Plot
ewew