
drwatkins
Dan Watkins
Recently Published

Intro to R
Or why you should learn to stop worrying and love statistical programming
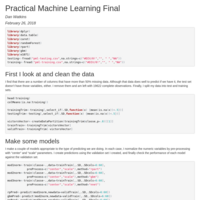
Practical Machine Learning wk 4
Results from my project for practical machine learning, week 4, from the Johns Hopkins Data Science Specialization on Coursera.
Shiny Cluster Demo Presentation Pitch
A presentation pitching the functionality of my shiny app, found at https://drwatkins.shinyapps.io/Cluster_Demonstration/
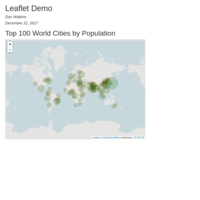
Leaflet Demo
Simple demo of leaflet plotting the top 100 world cities by population, with map interactivity and scaled population bubbles.
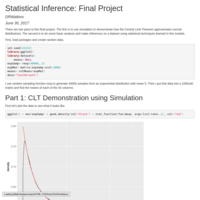
Statistical Inference, Project 2
Exploring the CLT via simulation and using 1- and 2-sample t-tests to make statistical inferences.
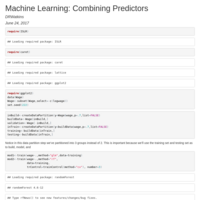
Machine Learning: Combining Predictors
An example of creating a generalized additive model using a linear model and a random forest model.
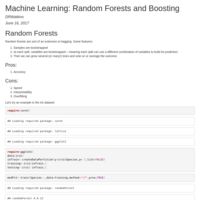
Machine Learning: Random Forests and Boosting
From week 3 of Coursera's "Practical Machine Learning" in the Data Science Specialization.
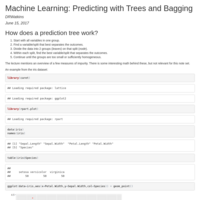
Machine Learning: Trees and Bagging
Notes from week 3 of the Coursera Data Science Specialization series.
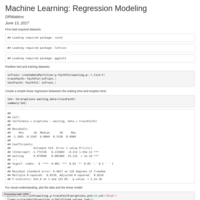
Machine Learning: Regression Modeling
Example of creating single- and multi-variate regression.models to predict wage data.
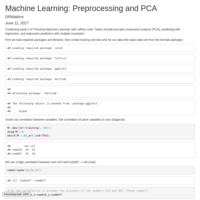
Machine Learning: Preprocessing and PCA/SVD
More machine learning, now using principle component analysis to preprocess the data.
Practical Machine Learning, Week 2
Data slicing, K-folds cross validation, k-nearest neighbor imputation, variable transformations (standardization, BoxCox transform).
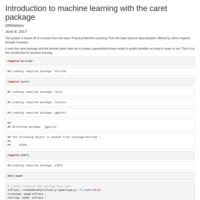
Basic Machine Learning Example
Using the caret package and the kernlab "spam" data set, I fit a basic GLM to predict whether an email is spam/notspam.
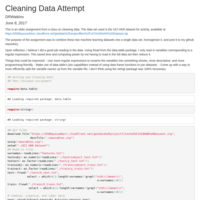
Data Cleaning Example
An assignment for a Data Cleaning class.
The script downloads a machine-learning data set with a total of 10299 observations, unzips it, reads in the relevant data from 5 files, combines them into a single tidy data set ordered by participant and activity.
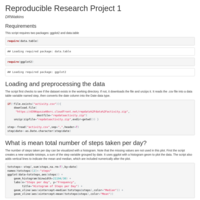
Reproducible Research, Project 1
Basic analysis on a simple activity tracking data set, available in code.
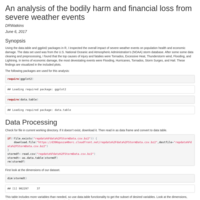
Reproducible Research, Project 2
This analysis is an exercise in literate programming using the knitr package in R. It uses the U.S. National Oceanic and Atmospheric Administration's (NOAA) storm database, with documentation available at:
https://d396qusza40orc.cloudfront.net/repdata%2Fpeer2_doc%2Fpd01016005curr.pdf
The analysis looks at 902297 observations of severe weather data with the intention of answering questions related to fatalities, injuries, and financial impact.