
ehlee
Eunhye Lee
Recently Published
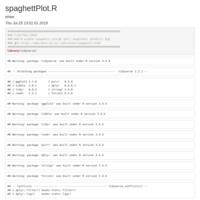
Spaghetti Plot
excerpted from "https://www.data-to-viz.com/caveat/spaghetti.html"
이것은 자전거 이야기가 아닙니다 (랜스 암스트롱)
책 발췌문 (2/11(월)/2019)

R Mark Down Test Document
created on 2/11(Mon)/2019

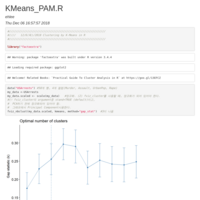
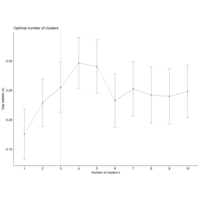
Clustering by PAM in R
as of December 7, 2018
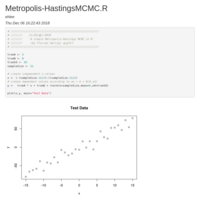
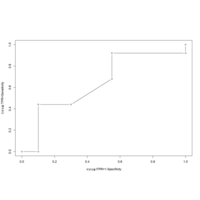
Clustering by KMeans in R
12/6(Thu)/2018

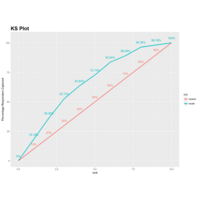
Plot: InformationValue::ks_plot( ) of Logistic Regression Analysis
Plot the cumulative percentage of responders (ones) captured by the model
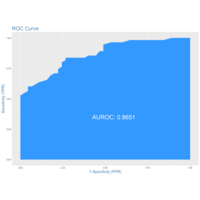
Plot: y~x1+x2+x3+x4
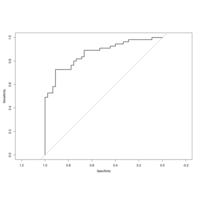
Test for plotting ROC curve of "y~x1+x2+x3+x4 for Logistic Regression" for data(logit)

Plot-y~x4 for Logistic Regression for data(logit)
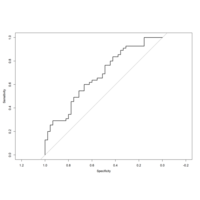
Test for plotting ROC Curve for Plot-y~x4 for Logistic Regression for data(logit)
Plot-y~x3 in Logistic Regression for data(logit)
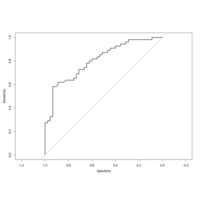
Test for plotting ROC Curve for Plot-y~x3 for Logistic Regression for data(logit)
Plot-y~x2 in Logistic Regression for data(logit)
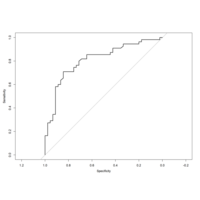
Test for plotting ROC Curve for Plot-y~x2 for Logistic Regression for data(logit)
Plot- y~x1 in Logistic Regression for data(logit)
Test for ROC Curve through package "rPOC"