
luizsatolo
Luiz Fernando Satolo
Recently Published


Exemplo de pontos extremos
Máximo, mínimo e ponto sela


Presentation
DSC slide deck
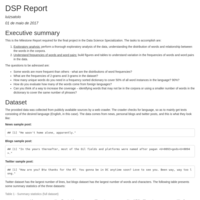
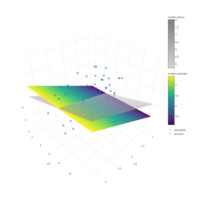
DSP report
Report for DSP course
Week 3 Assignment
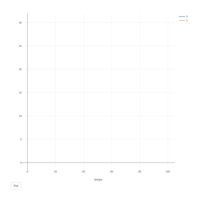
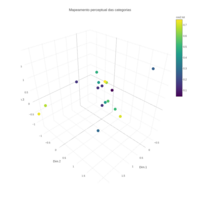
Presentation with a dynamic graph using plotly

Week 2 Assignment
Map produced with Leaflet package in R. The points that represent Carnaval parties are not real: they were just simulated as random points from normal distribution.
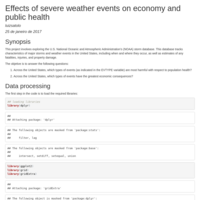
Effects of severe weather events on economy and public health
Reproducible Research - Course Project 2