
mph_R_mba
Manoj B Agravat
Recently Published

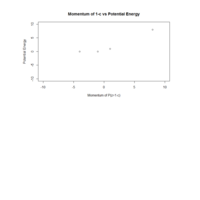
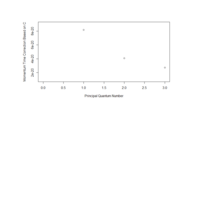
Principal Quantum Number Momentum and C Constant by Time
The principal quantum Number and momentum time correction based on speed of light shows lowest orbital has the most Energy
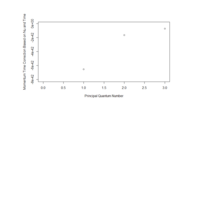
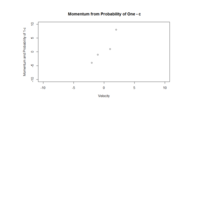
Principal Quantum Number and Momentum Frequency by TIme Correction
The Principal Quantum Number and momentum time correction shows for change in orbits, the momentum by frequency will be less negative.
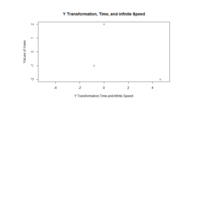
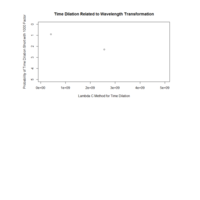
Figure 2
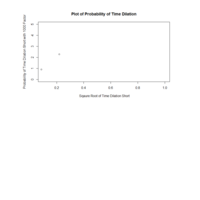
The time associated with Y transformation, and infinite speed shows a range of time which has a right triangle a small relationship though not equal for sides.
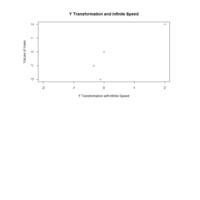
Figure 1
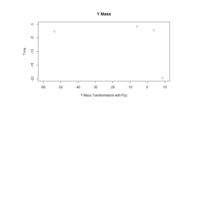
For the Y mass transformation and infinite Speed, and values of Y for mass and probability of three events, the pattern in nonlinear and hyper-parabolic


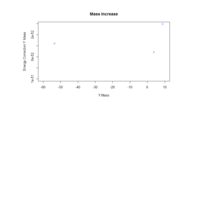

Untitled
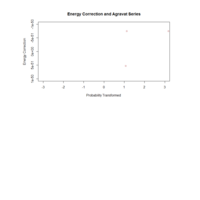
Energy Correction Transformed and Probability correction with Agravat Series shows an irregular right triangle from with all parameters transformed
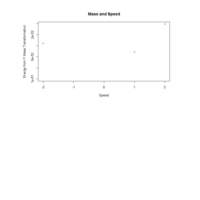
Untitled
The trend for energy correction and time correction is less with more time
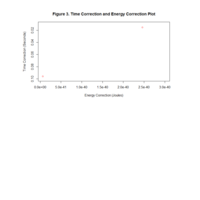
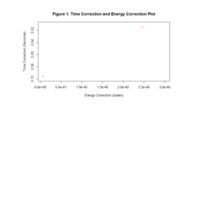
Figure 3.
The plot of time correction and energy plot shows a decreasing trend with points from artcile in
http://www.sjpub.org/sjp/sjp-111.pdf
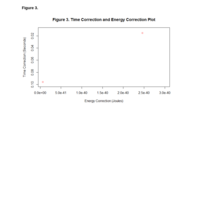
Figure 3. Time Correction and Energy Correction Plot
Time correction and energy plot in ( for points Science Journal of Phyics) and Science 2.0 show a decreasing trend for time correction
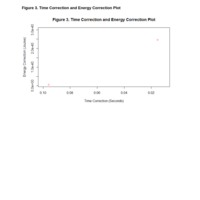
Figure 3. Time Correction and Energy Correction Plot
The plot shows according to SJPUB article the decreasing energy trend.
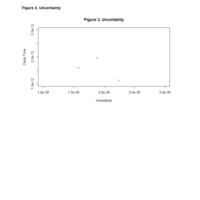
Figure 2. Uncertainty
The relationship of uncertainty is nonlinear.
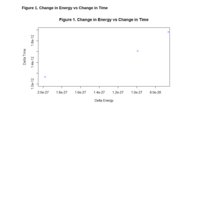
Figure 1. Change in Energy vs Change in Time
The change in time shows less energy
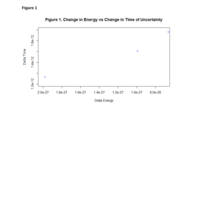
Figure 1 Change in Energy vs Time for Uncertainty and "N"
There is a decrease in energy for increase in time based on E~ mv/n.
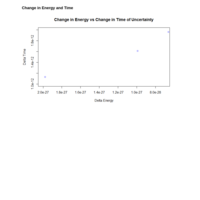
figure 1. Change in Energy and Time for Uncertainty
The plot shows the change in energy for increase in change in time for uncertainty.
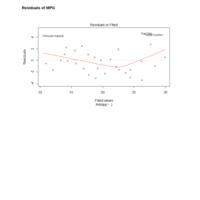
Residuals of MPG
The plot of residuals of MPG shows a nonlinear pattern.
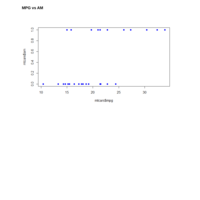
MPG vs AM
The plot of the variables MPG vs AM is here.
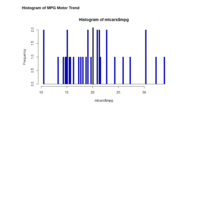
Histogram of MPG Motor Trend
This is a histogram of MPG's in Motor Trend