
pracademic
Henry Partridge
Recently Published
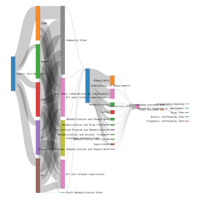
sankey
Sankey diagram using networkD3 package
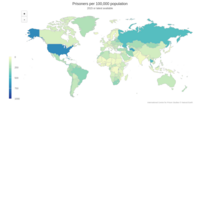
World incarceration rates (2015 or latest available)
A demo of Highmaps from the highcharter package using data from the International Centre for Prison Studies.

tasteR
A flavour of data analysis in R using Hadley Wickham's packages.
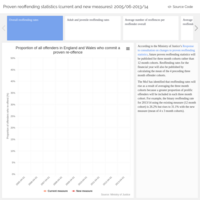
Proven reoffending statistics (current and new measures)
Ministry of Justice proven reoffending statistics presented using flexdashboard and Highcharter packages.

Constellation
Visualising a 'constellation' of artworks on show at Tate Liverpool using networkD3.
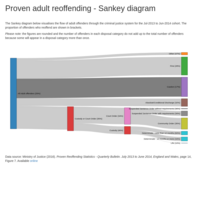
Proven adult reoffending - Sankey diagram
Sankey diagram showing the flow of adult offenders through England & Wales' criminal justice system.
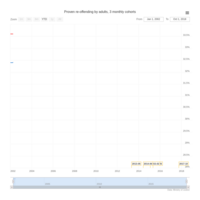
Binary proven reoffending rates
A time series of binary proven reoffending rates for adults using 3-month offender cohorts. Data provided by the Ministry of Justice.

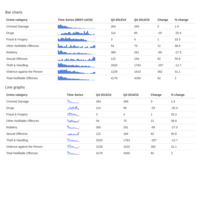
sparkline
Experimenting with different ways of visualising performance data using the jQuery Sparkline HTML Widget for R.
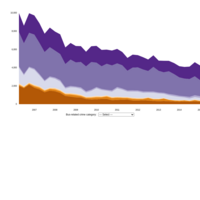
Visualising trends in London's bus-related crime using the streamgraph R package
Simple demo of the new streamgraph R package developed by Bob Rudis. For more information visit: http://hrbrmstr.github.io/streamgraph/.
Quarterly counts of bus-related crime were scraped from Crime & incident bulletins published by Transport for London.
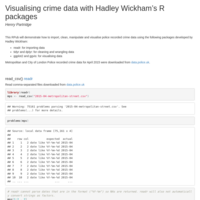
Visualising crime data with Hadley Wickham’s R packages
This RPub will demonstrate how to import, clean, manipulate and visualise police recorded crime data using packages developed by Hadley Wickham.
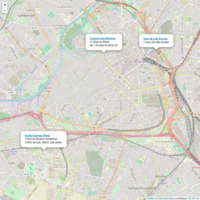
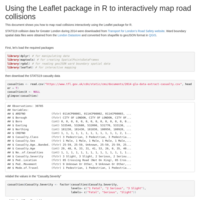
Using the Leaflet package in R to interactively map road collisions
This document shows you how to map road collisions interactively using the Leaflet package for R.
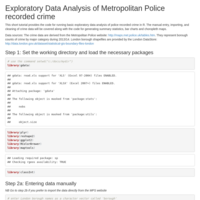
Exploratory Data Analysis of Metropolitan Police recorded crime
This short tutorial provides the code for running basic exploratory data analysis of police recorded crime in R. The manual entry, importing, and cleaning of crime data will be covered along with the code for generating summary statistics, bar charts and choropleth maps.
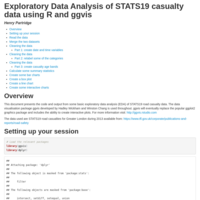
Using ggvis to explore road casualty data
This document uses ggvis and dplyr to explore road casualty data recorded in London during 2013.