
ryantillis
Ryan Tillis
Recently Published
NC Machine Learning Model Formulation
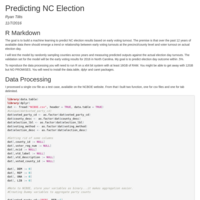
The goal is to build a machine learning to predict NC election results based on early voting turnout. The premise is that over the past 12 years of available data there should emerge a trend or relationship between early voting turnouts at the precinct/county level and voter turnout on actual election day.
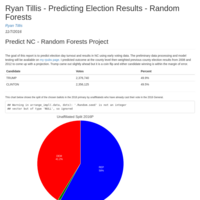
"Ryan Tillis - Predicting NC Election Results - Random Forests"
The goal of this report is to predict election day turnout and results in NC using early voting data.

Developing Data Products - Data Science - Presentation - Coursera - Ryan Tillis
Using a online accessible business dashboard eliminates the need for sending around files and the potential of altering a document in irreperable ways. This app is a proof of concept for a simple scenario testing dashboard for internal company projects. The inputs are divided by the phase of the project as in Startup, Operation, and Shutdown. In each phase different inputs can be adjusted and changed. All output are fully reactive.
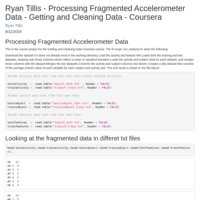
Ryan Tillis - Processing Fragmented Accelerometer Data - Getting and Cleaning Data - Coursera
This is the course project for the Getting and Cleaning Data Coursera course. The R script, run_analysis.R, does the following:
Download the dataset if it does not already exist in the working directory
Load the activity and feature info
Loads both the training and test datasets, keeping only those columns which reflect a mean or standard deviation
Loads the activity and subject data for each dataset, and merges those columns with the dataset
Merges the two datasets
Converts the activity and subject columns into factors
Creates a tidy dataset that consists of the average (mean) value of each variable for each subject and activity pair.
The end result is shown in the file tidy.txt.
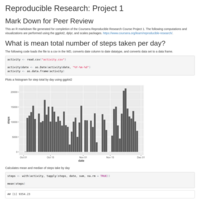
Reproducible Research: Project 1
This an R markdown file generated for completion of the Coursera Reproducible Research Course Project 1. The following computations and visualizations are performed using the ggplot2, dplyr, and scales packages. https://www.coursera.org/learn/reproducible-research/.
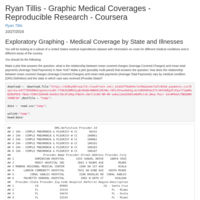
Ryan Tillis - Graphing Medical Coverages - Reproducible Research - Coursera
Make a plot that answers the question: what is the relationship between mean covered charges (Average.Covered.Charges) and mean total payments (Average.Total.Payments) in New York?
Make a plot (possibly multi-panel) that answers the question: how does the relationship between mean covered charges (Average.Covered.Charges) and mean total payments (Average.Total.Payments) vary by medical condition (DRG.Definition) and the state in which care was received (Provider.State)?
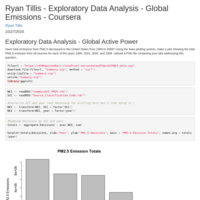
Ryan Tillis - Exploratory Data Analysis - Global Emissions - Coursera
Have total emissions from PM2.5 decreased in the United States from 1999 to 2008? Using the base plotting system, make a plot showing the total PM2.5 emission from all sources for each of the years 1999, 2002, 2005, and 2008. Upload a PNG file containing your plot addressing this question.
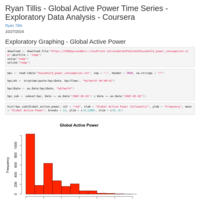
Ryan Tillis - Global Active Power Time Series - Exploratory Data Analysis - Coursera
Exploratory graphs of global active power from sub metering data on certain days of the year.
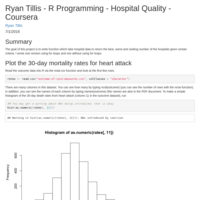
Ryan Tillis - R Programming - Hospital Quality - Coursera
R programming project for sorting hospital data.
Ryan Tillis - Plotly Presentation - Data Products - Coursera
Plotly Presentation Assignment: Developing Data Products
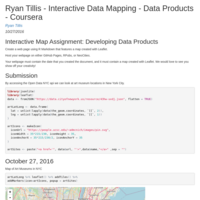
Ryan Tillis - Interactive Data Mapping - Data Products - Coursera
By accessing the Open Data NYC api we can look at art museum locations in New York City. Points are clickable for more information.
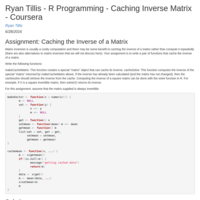
Ryan Tillis - R Programming - Caching Inverse Matrix - Coursera
makeCacheMatrix: This function creates a special “matrix” object that can cache its inverse. cacheSolve: This function computes the inverse of the special “matrix” returned by makeCacheMatrix above.
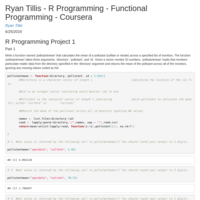
Ryan Tillis - R Programming - Functional Programming - Coursera
Write a function named 'pollutantmean' that calculates the mean of a pollutant (sulfate or nitrate) across a specified list of monitors. The function 'pollutantmean' takes three arguments: 'directory', 'pollutant', and 'id'. Given a vector monitor ID numbers, 'pollutantmean' reads that monitors' particulate matter data from the directory specified in the 'directory' argument and returns the mean of the pollutant across all of the monitors, ignoring any missing values coded as NA.
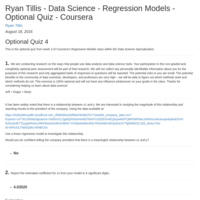
Ryan Tillis - Data Science - Regression Models - Optional Quiz - Coursera
This is the optional quiz from week 3 of Coursera’s Regression Models class within the Data Science Specialization.
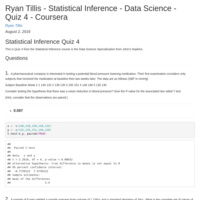
Ryan Tillis - Statistical Inference - Data Science - Quiz 4 - Coursera
This is Quiz 4 from the Statistical Inference course in the Data Science Specialization from John's Hopkins.
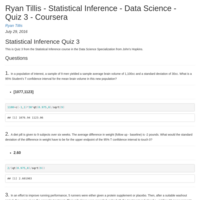
Ryan Tillis - Statistical Inference - Data Science - Quiz 3 - Coursera
This is Quiz 3 from the Statistical Inference course in the Data Science Specialization from John's Hopkins.
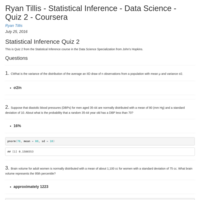
Ryan Tillis - Statistical Inference - Data Science - Quiz 2 - Coursera
This is Quiz 2 from the Statistical Inference course in the Data Science Specialization from John’s Hopkins.
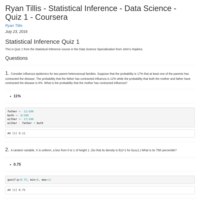
Ryan Tillis - Statistical Inference - Data Science - Quiz 1 - Coursera
This is Quiz 1 from the Statistical Inference course in the Data Science Specialization from John’s Hopkins.
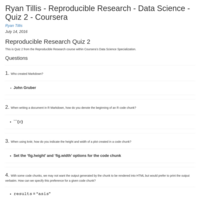
Ryan Tillis - Reproducible Research - Data Science - Quiz 2 - Coursera
This is Quiz 2 from the Reproducible Research course within Coursera's Data Science Specialization.
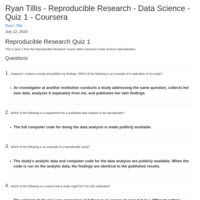
Ryan Tillis - Reproducible Research - Data Science - Quiz 1 - Coursera
This is Quiz 1 from the Reproducible Research course within Coursera’s Data Science Specialization.
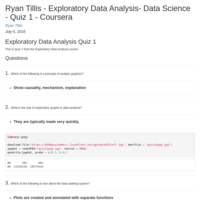
Ryan Tillis - Exploratory Data Analysis- Data Science - Quiz 1 - Coursera
This is Quiz 1 from the Exploratory Data Analysis course

Ryan Tillis - Exploratory Data Analysis- Data Science - Quiz 2 - Coursera
This is Quiz 2 from the Exploratory Data Analysis course within the Data Science Specialization on Coursera.
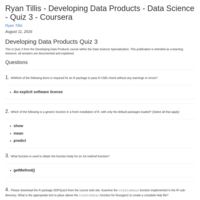
Ryan Tillis - Developing Data Products - Data Science - Quiz 3 - Coursera
This is Quiz 3 from the Developing Data Products course within the Data Science Specialization. This publication is intended as a learning resource, all answers are documented and explained.
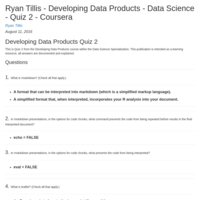
Ryan Tillis - Developing Data Products - Data Science - Quiz 2 - Coursera
This is Quiz 2 from the Developing Data Products course within the Data Science Specialization. This publication is intended as a learning resource, all answers are documented and explained.
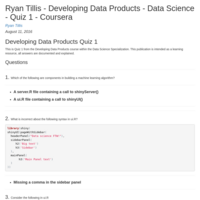
Ryan Tillis - Developing Data Products - Data Science - Quiz 1 - Coursera
This is Quiz 1 from the Developing Data Products course within the Data Science Specialization. This publication is intended as a learning resource, all answers are documented and explained.
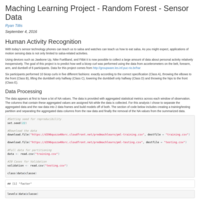
Maching Learning Project - Random Forest - Sensor Data
With today’s sensor technology phones can teach use to salsa or watches can teach us how to eat salsa effectively. As you might expect, applications are not limited to only salsa-related activities.
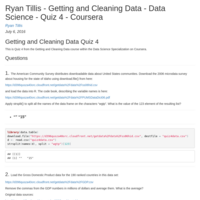
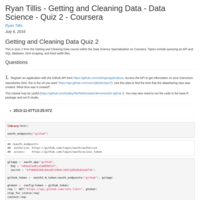
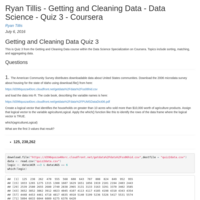
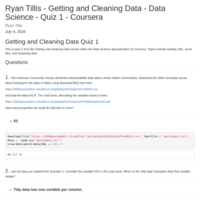
Ryan Tillis - Getting and Cleaning Data - Data Science - Quiz 4 - Coursera
This is Quiz 4 from the Getting and Cleaning Data course within the Data Science Specialization on Coursera.
Ryan Tillis - Getting and Cleaning Data - Data Science - Quiz 2 - Coursera
This is Quiz 2 from the Getting and Cleaning Data course within the Data Science Specialization on Coursera. Topics include querying an API and SQL database, html scraping, and fixed width files.
Ryan Tillis - Getting and Cleaning Data - Data Science - Quiz 3 - Coursera
This is Quiz 3 from the Getting and Cleaning Data course within the Data Science Specialization on Coursera. Topics include sorting, matching, and aggregating data.
Ryan Tillis - Getting and Cleaning Data - Data Science - Quiz 1 - Coursera
This is Quiz 1 from the Getting and Cleaning Data course within the Data Science Specialization on Coursera. Topics include reading XML, excel files, and extracting data.
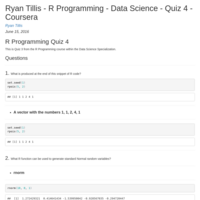
Ryan Tillis - R Programming - Data Science - Quiz 4 - Coursera
This is Quiz 4 from the R Programming course within the Data Science Specialization.
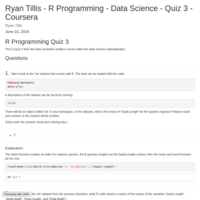
Ryan Tillis - R Programming - Data Science - Quiz 3 - Coursera
This is Quiz 3 from the Data Scientist's toolbox course within the Data Science Specialization.
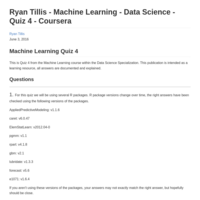
Ryan Tillis - Machine Learning - Data Science - Quiz 4 - Coursera
This is Quiz 4 from the Machine Learning course within the Data Science Specialization. This publication is intended as a learning resource, all answers are documented and explained. Topics include machine support vectors, forecasting, ensembling, random forests, and boosting.
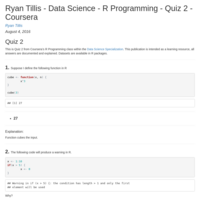
Ryan Tillis - Data Science - R Programming - Quiz 2 - Coursera
This is Quiz 2 from Coursera’s R Programming class within the Data Science Specialization. This publication is intended as a learning resource, all answers are documented and explained. Datasets are available in R packages.
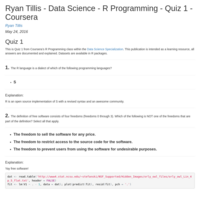
Ryan Tillis - Data Science - R Programming - Quiz 1 - Coursera
This is Quiz 1 from Coursera's R Programming class within the Data Science Specialization. This publication is intended as a learning resource, all answers are documented and explained. Datasets are available in R packages.
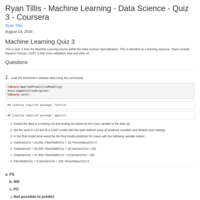
Ryan Tillis - Machine Learning - Data Science - Quiz 3 - Coursera
This is Quiz 3 from the Machine Learning course within the Data Science Specialization. This is intended as a learning resource. Topics include Random Forests, CART, k-fold cross validation, bias and olive oil.
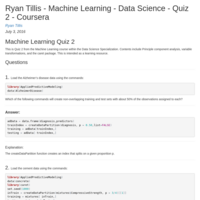
Ryan Tillis - Machine Learning - Data Science - Quiz 2 - Coursera
This is Quiz 2 from the Machine Learning course within the Data Science Specialization. Contents include Principle component analysis, variable transformations, and the caret package. This is intended as a learning resource.
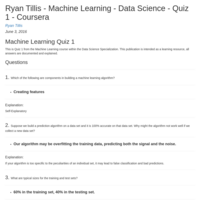
Ryan Tillis - Machine Learning - Data Science - Quiz 1 - Coursera
This is Quiz 1 from the Machine Learning course within the Data Science Specialization. This publication is intended as a learning resource, all answers are documented and explained.
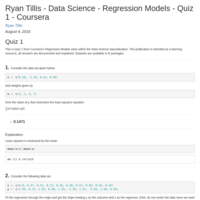
Ryan Tillis - Data Science - Regression Models - Quiz 1 - Coursera
This is Quiz 1 from Coursera's Regression Models class within the Data Science Specialization. This publication is intended as a learning resource, all answers are documented and explained. Datasets are available in R packages.
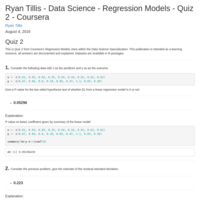
Ryan Tillis - Data Science - Regression Models - Quiz 2 - Coursera
This is Quiz 2 from Coursera's Regression Models class within the Data Science Specialization. This publication is intended as a learning resource, all answers are documented and explained. Datasets are available in R packages.
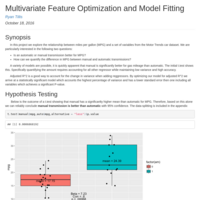
Ryan Tillis - Multivariate Feature Optimization and Model Fitting
Goldilocks! This optimal fit accounts for almost the same amount of variance as the first model, AND has a significant P-value (for our purpose).

Ryan Tillis - Data Science - Regression Models - Quiz 4 - Coursera
This is Quiz 4 from Coursera’s Regression Models class within the Data Science Specialization. This publication is intended as a learning resource, all answers are documented and explained. Datasets are available in R packages
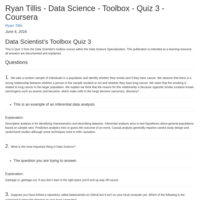
Ryan Tillis - Data Science - Data Scientist's Toolbox - Quiz 3 - Coursera
This is Quiz 3 from the Data Scientist's toolbox course within the Data Science Specialization. This publication is intended as a learning resource, all answers are documented and explained.
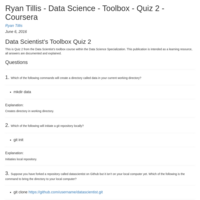
Ryan Tillis - Data Science - Data Scientist's Toolbox - Quiz 2 - Coursera
This is Quiz 2 from the Data Scientist's toolbox course within the Data Science Specialization. This publication is intended as a learning resource, all answers are documented and explained.
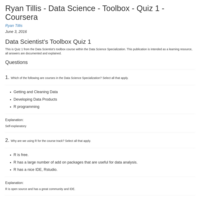
Ryan Tillis - Data Science - Data Scientist's Toolbox - Quiz 1 - Coursera
This is Quiz 1 from the Data Scientist’s toolbox course within the Data Science Specialization. This publication is intended as a learning resource, all answers are documented and explained.
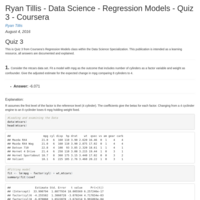
Ryan Tillis - Data Science - Regression Models - Quiz 3 - Coursera
This is Quiz 3 from Coursera’s Regression Models class within the Data Science Specialization. This publication is intended as a learning resource, all answers are documented and explained.
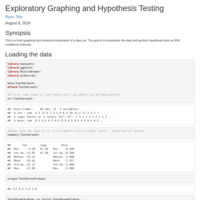
Exploratory Graphing and Hypothesis Testing
This is a brief graphical and numerical exploration of a data set. The goal is to summarize the data and perform hypothesis tests at 95% confidence intervals.
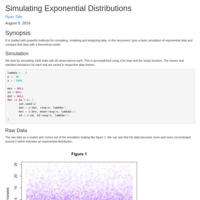
Simulating Exponential Distributions
R is loaded with powerful methods for simulating, modeling and analyzing data. In this document I give a basic simulation of exponential data and validate the data against a theoretical model.

Analyzing the Impact of Severe Weather Events
This analysis is a brief exploration of the U.S. National Oceanic and Atmospheric Administration's (NOAA) storm database. The primary goal of this analysis is to answer the following two questions:
1. Across the United States, which types of events (as indicated in the