
anthonybmasters
Anthony Masters
Recently Published
Survation-RH Most Important Issue Cartogram
The purpose of this code is to make a cartogram of modelled most important issues by constituency. Analysts at Royal Holloway used Survation polling to model opinion in each constituency.
COVID Tracker ICU Patients
The purpose of this code is to create graphs showing ICU patients in US states. The statistics come from the COVID Tracker Project.
Notified Covid-19 deaths in Ireland
The purpose of this code is to show notified Covid-19 deaths in Ireland. The graphs will show the reporting cycle and deaths by both reporting date and date of occurrence. The statistics come from the Health Protection Surveillance Centre Covid-19 Data Hub API.
Covid-19 Trends in Wales
The purpose of this code is to show different coronavirus-related measures in Wales. The figures come from Public Health Wales (via the UKHSA R package) and the Office for National Statistics infection survey.
ONS Relative Age-Standardised Mortality
The purpose of this code is to produce a graph showing relative age-standardised mortality rates in selected European countries. The Office for National Statistics published
Australian Deaths and Mortality Rates
The purpose of this code is to create graphs showing mortality statistics in Australia. The figures come from the Australian Bureau of Statistics API and a published online file.
RSS Public Survey 2021
The purpose to create a graph showing posterior distributions for estimates in an RSS-commission survey of the public. Market research company Opinium conducted this survey.
NHS England Covid Hospital Beds (Non-Acute Trusts)
The purpose of this code is to show statistics for Covid-19 patients in England. In acute trusts, this is split by primary diagnosis.
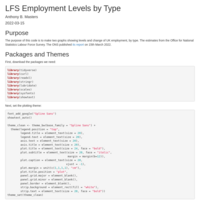
LFS Employment Levels by Type
The purpose of this code is to make two graphs showing levels and change of UK employment, by type. The estimates from the Office for National Statistics Labour Force Survey.
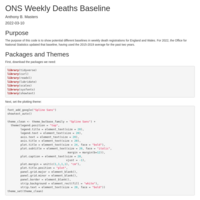
ONS Weekly Deaths Baseline
The purpose of this code is to show potential different baselines in weekly death registrations for England and Wales. For 2022, the Office for National Statistics updated that baseline, having used the 2015-2019 average for the past two years.
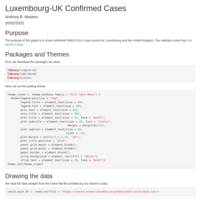
Luxembourg-UK Confirmed Cases
The purpose of this graph is to show confirmed SARS-CoV-2 case counts for Luxembourg and the United Kingdom. The statistics come from Our World in Data.
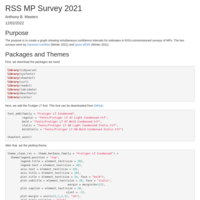
RSS MP Survey 2021
The purpose is to create a graph showing simultaneous confidence intervals for estimates in RSS-commmisioned surveys of MPs. The two surveys were by Savanta ComRes (Winter 2021) and Ipsos MORI (Winter 2011).
NISRA Northern Ireland Weekly Deaths
The purpose of this code is to consider how to show other series on stacked bar graphs. As an example, we use weekly registered deaths in Northern Ireland, published by NISRA.
Covid-19 surveillance deaths weekly cycle
The purpose of this code is to visualise the reporting cycle in Covid-19 deaths in England. The figures are surveillance counts: deaths within 28 days of a positive test. Statistics come from the UKHSA Covid-19 dashboard.
Confirmed cases in England by test type
The purpose of this R code is to create a graph showing confirmed cases by test type in England. The data is downloaded from the UKHSA Covid-19 dashboard.
ONS Weekly Excess Deaths by Location
The R code produces a graph showing excess deaths (with the 2015-2019 average as the baseline) by location in England and Wales. These statistics are published by the Office for National Statistics.
NHS England Covid Hospital Beds II
The purpose of this code is show total Covid-19 beds in London, by primary diagnosis. This is given in two data files on the NHS England website.
ONS Monthly Mortality Analysis England
The purpose of this code is to make graphs showing age-standardised and age-specific mortality rates in England across time. A second graph shows the age-standardised components. These graphs use the Office for National Statistics' monthly mortality analyses for England and Wales.
Rapid and Confirmatory Tests
This code produces graph showing the impacts on infection probabilities following different test results.
StatsWales Vaccine Not Suitable for Use
The purpose of this code is to produce a graph of cumulative vaccine wastage by vaccine type in Wales. This open data comes from StatsWales.
NHS England Data Wrangling II
This code wrangles data straight from an online file on the NHS England website, producing graphs with population estimates and vaccine coverage by age group.
NHS England Covid Hospital Beds
The purpose of this R code is to show total beds occupied by confirmed Covid-19 patients, by primary admission reason. This is given in a data file on the NHS England website.
PHE Vaccine Coverage Revision
The purpose of this R code is to show the revision to vaccine coverage (by dose) for the adult population in England. This is drawn from two sheets downloaded from the Public Health England Coronavirus dashboard.
Age at Death by UK Nation
The purpose of this R code is to draw data from the online UK Life Table showing numbers dying at exact ages (dx). Once drawn, we can create a graph showing the expected numbers dying at single years of age from a synthetic cohort, by UK nation.
NHS Vaccination Data Wrangling
The purpose of this R code is to produce a graph showing Covid-19 vaccine coverage in England by age group and population estimates. The goal is to wrangle the data directly from the NHS England online spreadsheet into that graph.

Vaccine Effectiveness
The purpose of this R code is to show vaccine effectiveness in an illustrative at-risk population. That shows the counter-intuitive result with sufficiently high coverage, most deaths from the disease will be among those vaccinated (assuming 94% protection).
UK General Election Opinion Polling Wiki
This R Markdown looks at the effect of using different spans for local regression (Loess) curves, for UK/GB general election vote intention polls.
A/B Testing
This R code compares different uncertainty intervals for an A/B test, and produces a 'dots' posterior distribution graph.
Birthday Problem
This R code simulates the birthday problem with ONS birth statistics from 1995 to 2014. The results are similar to the simplified standard calculation.
Pub Industry Turnover Losses Estimates
This code makes distributional assumptions, and then simulates potential values of UK public houses in 2020. Those simulations are presented as a dot plot.
Senedd 2021 Vote Intention Estimates
This code creates mosaic graphs, showing vote intention estimates by polling company. This is for the Senedd 2021 elections.
Google Trends Data - 2021-04-28
This code produces a graph showing Google search volume indices for three different search queries.
ONS Weekly Death Registrations Figure 3
This code emulates the Figure 3 graph from the Office for National Statistics weekly death registration report.
One Hundred Thousand
The purpose of this document is to produce graphs with 10,000 and 100,000 dots. This is to help show the odds of one in 10,000 and one in 100,000.
Sweden Mortality 2020
I produce an ONS-style for Swedish mortality in 2020. Statistics Sweden excludes deaths with unknown dates of occurrence. The average of week 52 is used for week 53.
ONS Mortality Rates II
This analysis looks at changes in age-standardised mortality rates in England and Wales over time. There are two graphs, one showing the rates and changes, and the other is a dot-plot of changes.
Diagnostic Testing - Stochastic
The purpose of this R code is to show much precision and negative predictive values vary. This is for a binary diagnostic test, where there is low prevalence.
Savanta ComRes Scottish Independence Polling
The purpose of this R code is to produce a graph, showing Scottish independence polling results by weighting schema. Survey statistics can be drawn from the Savanta ComRes polling archive.
PHE Weekly COVID-19 and Flu Small Multiples
This R code generates a small multiples graph, showing COVID-19 and influenza hospital admission rates by week in English regions. The statistics come from SARI Watch, and are published by Public Health England.
ONS Beta API (Labour Market)
The purpose of this code is to draw a employment time series from the ONS beta API. I used that data frame to create a graph of the UK employment rate for people aged 16-64.
ONS Mortality Rates
This code creates two graphs, concerning death registrations and mortality rates in England and Wales. The graphs cover 1900 to 2020 (provisional). Thomas Lin Pederson's patchwork package is used to join two sub-graphs together.
COVID-19 Hospital Phase Graphs
The purpose of this code is to create graphs showing COVID-19 admissions and patients over time. This code will use Public Health England's R package ukcovid19.
Coronavirus Deaths by Data Source - 2021-01-30
The purpose of this code is to create graphs comparing two different COVID-19 death measures by date of death.
The first measure is death registrations from the Office for National Statistics. This analysis uses the data file for registrations up to 15th January 2021.
The second measure is confirmed deaths from Public Health England (who report for the UK on their dashboard). Here, rather than using a prepared file, I draw the figures straight from the API.
Data Manipulation in Base R and Tidyverse
The purpose of this code is to compare Base R and tidyverse code for data manipulation.
ONS COVID-19 Model Estimates - 2020-12-12
This document produces two animated graphs. These graphs show how the ONS COVID-19 positivity and incidence models in England develop over time. The positivity model is more stable than the incidence model.
ONS COVID-19 Model Estimates
The code creates an animated graph of ONS modelled incidence rates of COVID-19 in England. The graph shows how the modelled estimates are revised over time.
SA PowerBall Lottery
This document calculates the probability of a numerical sequence occurring at least once in many draws. The calculations are for the South African PowerBall lottery.
PHE Coronavirus Package ukcovid19
This R Markdown document uses the ukcovid19 package from Public Health England to create a graph. This package could underlie repeatable analyses or data visualisations.
Newcomb-Benford Distributions
This page looks at Newcomb-Benford distributions and 2020 US Presidential election results. The graphs show why we would not expect conformity to Benford's Law of vote counts in Chicago precincts.
Systematic Sampling
The R Markdown document simulates populations. We then calculate the standard errors for systematic and simple random sampling. These standard errors are then compared in a scatter graph.
PHE Case Rates by Age Group
This page creates a heatmap of lab-confirmed SARS-CoV-2 cases in England per 100,000 people in each age group. This is from Public Health England statistics.
Prevalence and Positive Rates
This document illustrates the central estimate of true and false positive results against prevalence.
Bayesian A/B Test
This document looks at a Bayesian analysis of an A/B test. Using uniform priors, I use numerical methods to calculate the posterior distribution and produce a graph. I also compare the mean and interval estimate to an approximation.
House Effects - 2020-09-12
This R Markdown document creates an automated table. The inputs are UK vote intention polls. The output is a table of estimated house effects for each polling company.
House Effects
This R Markdown document produces generalised additive models (using the mgcv package), in order to estimate polling company house effects. The code also makes a graph showing vote intention estimates over time, by company.
Coronavirus Deaths by Data Source - 2020-08-05
This document produces three graphs: for England, Wales, and Scotland.
The graphs compare deaths involving COVID-19 for statistics offices (ONS and NRS) and public health agencies (PHE, PHW, and PHS).
Coronavirus Deaths by Source
This R Markdown document creates two graphs, with annotations.
The graphs compare deaths with COVID-19 from Public Health England and Public Health Wales to the Office for National Statistics. The ONS death certificate mentions were drawn from a weekly occurrence reportPHE and PHW statistics comes from the Public Health England Coronavirus Staging Dashboard.
European Social Survey 09-GB
This R Markdown page creates a graph by different weights for the UK's hypothetical EU membership referendum question.
Coronavirus cases in Wiltshire
This R Markdown document shows how to make a graph of confirmed SARS-CoV-2 cases in Wiltshire.
Google Search Index
This R Markdown document creates graphs of Google search trends.
The trends are shown as a rounded index, where 100 is the highest volume. We can draw Google search indices from the Google Trends tool.
Forest Fires Function
This code creates a function which simulates forest fires. The simulations are run across lattice graphs with added edges.
Weekly Death Registrations
This article looks at weekly death registrations in England and Wales. The code produces three graphs which show trends in death registrations.
GE 2017 Majorities
This document produces counts and graphs about constituency majorities in the 2017 General Election.
Doubling Times
This document calculates doubling times (over seven days) for confirmed COVID-19 deaths. The graph shows doubling times for five selected countries.
Log Graphs
This document creates to compare linear and logarithmic scales.
False Positives and False Negatives
Using three illustrative examples, this document shows the importance of prevalence, false positive and false negative rates.
Mortgage Overpayment
This document uses functions to create mortgage repayment tables. The document then shows the effect of different over-payment schedules.

Dice Rolls and the Law of Large Numbers
This R Markdown document shows the code for creating static and animated graphs. The aim is to show a different version of the Law of Large Numbers, applying it to dice rolls and their cumulative sum.
GE2019 Constituency Polling Accuracy
This R code creates graphs showing the errors (net by party and three party absolute) of each constituency poll over time, in the 2019 UK General Election.
Parallel Tests
This document creates a graph showing different p-value calculations for pairs of proportions, under different modelling assumptions.
GE Vote Shares 1918 to 2019
The code shows how to create four graphs for General Election vote share: in England, Scotland, Wales, and England plus Wales.
BARB Weekly Viewing
This document contains R code for graphs showing the BBC's weekly reach and viewing share.
GE Vote Share Changes
This document shows how the declared aggregate vote share changes between the 2017 and 2019 General Elections developed on election night.
A Degree of Extrapolation
This document contains code on forecasting the proportion of Firsts in 2029/30, using HESA statistics.
UK Vote Shares (1918 - 2019)
This graph shows UK vote shares in General Elections from 1918 to 2019.
Exit Poll Performance (2001 - 2019)
This code is to create a graph showing exit poll in the past six General Elections.
Illustrating the Ecological Fallacy
This code creates two graphs for an illustrative election -- as an example of the ecological fallacy.
Illustrating False Recall
This article provides code for three graphs, illustrating the problem of false recall in social research.
Self-Selecting Surveys
This article creates a graph which compares an actual polling average to self-selecting Facebook surveys, on the subject of an EU membership referendum.
Chippenham 2017 Result
This document looks at creating a graph of the 2017 General Election result in Chippenham.

Ipsos MORI Survey Dumbbell Graph
This article uses geom_dumbbell to recreate a graph showing changes in moral attitudes over the past 30 years.
Another article recreating a Pew Research Center graph may be read here: https://rud.is/b/2016/04/17/ggplot2-exercising-with-ggalt-dumbbells/
Survey Weights in R
This article shows the usage of various functions in the survey package, with dummy survey data.
FCA Net Short Position Disclosures
In an attempt to replicate a graph in the Byline Times, I use the FCA public disclosures data-set which shows large net short position changes.
Vegans in EWNI (Food and You)
This document looks how to create a graph of vegans and complete vegetarians from the first five waves of the Food and You survey. This survey has most recently covered adults in England, Wales and Northern Ireland, and the fifth wave was conducted by NatCen and NISRA.
EU Referendum Vote Recall to Current Vote Intention Sankey
This code produces a Sankey diagram in the GoogleVis package, using the central estimates from a recent Opinium internet panel survey.
Number Cruncher Politics Poll of Brecon & Radnorshire
This is a graph showing central estimates from the Number Cruncher Politics poll of Brecon & Radnorshire. The graph uses facet wraps to show both the vote intention share estimate and the implied change from the 2017 General Election.
Is there a curse of Aaron Ramsey?
This article runs statistical tests (exact Binomial and a similar Bayesian test). Additionally, I create a graph showing the number of days with specified events by football season (August to May).
ComRes/Fathers4Justice Survey Graph
This graph shows the results of one question in the ComRes internet panel survey of 1,015 fathers, conducted between 29th May and 4th June 2019. The survey was commissioned by campaign group Fathers4Justice.
Margins of Sampling Error
Under the assumption of a simple random sample, the code creates a graph for margins of sampling error at different proportions and sample sizes (for 95% confidence intervals).
MPs on Twitter (R Code)
This document will contain all relevant R code for my poster about British MPs on Twitter.
Council Tax by Local Authority Control 2019-20
This document shows the steps used to create a summary table and graphs for council tax measures by local authority (overall) control. This is to be compared against claims made by the Conservative and Labour parties.
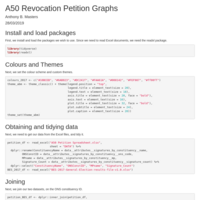
A50 Revocation Petition Graphs
This document shows how to connect the A50 revocation petition data to the BES 2017 Constituency results dataset (for GB constituencies). Two scatter graphs are drawn, comparing the Level 4 qualification share and Remain estimate against the signature shares by constituency.
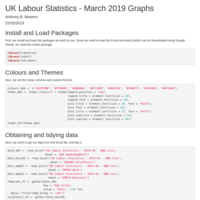
UK Labour Statistics - March 2019 Graphs
This publication contains the R code for graphs on various UK labour market measures.
EU Referendum Polling Economist Graph Check
This documents look at different ways of representing polling data before and after the UK's European Union membership referendum, including introducing a discontinuity in the Loess regression curves at the referendum date.