
hvasquez81
Henry Vasquez
Recently Published

DATA607 - Assignment Week 9
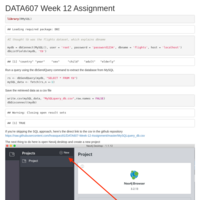
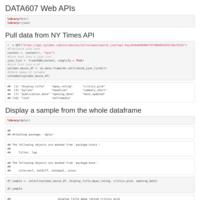
The New York Times web site provides a rich set of APIs, as described here: http://developer.nytimes.com/docs You’ll need to start by signing up for an API key.
Your task is to choose one of the New York Times APIs, construct an interface in R to read in the JSON data, and transform it to an R dataframe.
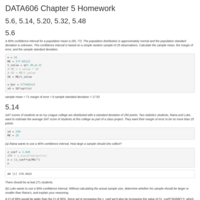
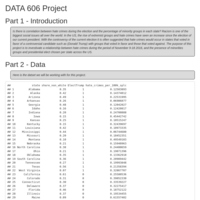
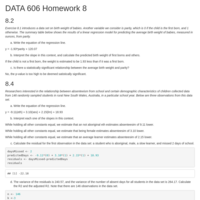
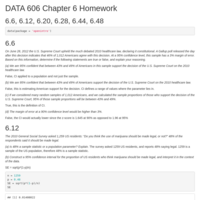
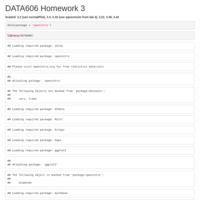
DATA 606 Homework 5
Chapter 5 Homework

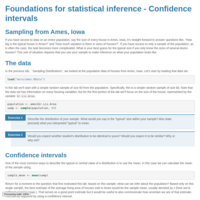
DATA606 - Lab 4b
Confidence intervals
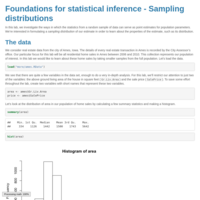
DATA606 - Lab 4a
Sampling distribution
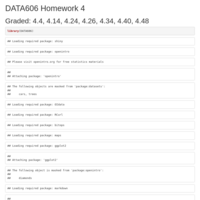
DATA 606 Homework 4
Homework assignment
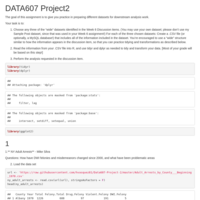
DATA607 - Project 2
The goal of this assignment is to give you practice in preparing different datasets for downstream analysis work.
Your task is to:
(1) Choose any three of the “wide” datasets identified in the Week 6 Discussion items. (You may use your own dataset; please don’t use my Sample Post dataset, since that was used in your Week 6 assignment!) For each of the three chosen datasets:
Create a .CSV file (or optionally, a MySQL database!) that includes all of the information included in the dataset. You’re encouraged to use a “wide” structure similar to how the information appears in the discussion item, so that you can practice tidying and transformations as described below.
Read the information from your .CSV file into R, and use tidyr and dplyr as needed to tidy and transform your data. [Most of your grade will be based on this step!]
Perform the analysis requested in the discussion item.
Your code should be in an R Markdown file, posted to rpubs.com, and should include
narrative descriptions of your data cleanup work, analysis, and conclusions. (2) Please include in your homework submission, for each of the three chosen datasets:
The URL to the .Rmd file in your GitHub repository, and The URL for your rpubs.com web page.
DATA606 - Assignment 3
Homework problems
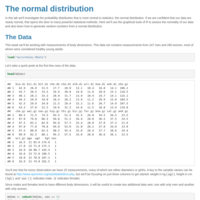
DATA606 - Lab 3
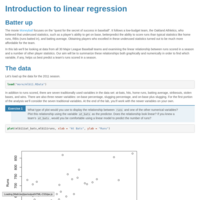
In this lab we’ll investigate the probability distribution that is most central to statistics: the normal distribution. If we are confident that our data are nearly normal, that opens the door to many powerful statistical methods. Here we’ll use the graphical tools of R to assess the normality of our data and also learn how to generate random numbers from a normal distribution
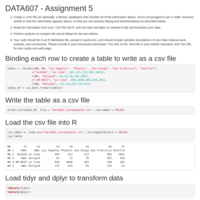
DATA607 - Assignment 5
Create a .CSV file (or optionally, a MySQL database!) that includes all of the information above. You’re encouraged to use a “wide” structure similar to how the information appears above, so that you can practice tidying and transformations as described below.
Read the information from your .CSV file into R, and use tidyr and dplyr as needed to tidy and transform your data.
Perform analysis to compare the arrival delays for the two airlines.
Your code should be in an R Markdown file, posted to rpubs.com, and should include narrative descriptions of your data cleanup work, analysis, and conclusions. Please include in your homework submission: The URL to the .Rmd file in your GitHub repository and??? URL for your rpubs.com web page.
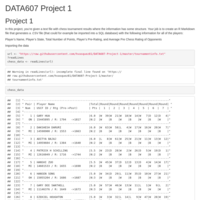
DATA607 - Project 1
In this project, you’re given a text file with chess tournament results where the information has some structure. Your job is to create an R Markdown file that generates a .CSV file (that could for example be imported into a SQL database) with the following information for all of the players:
Player’s Name, Player’s State, Total Number of Points, Player’s Pre-Rating, and Average Pre Chess Rating of Opponents
For the first player, the information would be:
Gary Hua, ON, 6.0, 1794, 1605
1605 was calculated by using the pre-tournament opponents’ ratings of 1436, 1563, 1600, 1610, 1649, 1663, 1716, and dividing by the total number of games played.
If you have questions about the meaning of the data or the results, please post them on the discussion forum. Data science, like chess, is a game of back and forth...
The chess rating system (invented by a Minnesota statistician named Arpad Elo) has been used in many other contexts, including assessing relative strength of employment candidates by human resource departments.
You may substitute another text file (or set of text files, or data scraped from web pages) of similar or greater complexity, and create your own assignment and solution. You may work in a small team. All of your code should be in an R markdown file (and published to rpubs.com); with your data accessible for the person running the script.
DATA606 - Lab 2
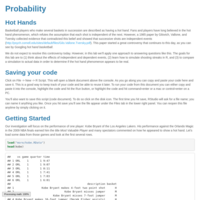
Basketball players who make several baskets in succession are described as having a hot hand. Fans and players have long believed in the hot hand phenomenon, which refutes the assumption that each shot is independent of the next. However, a 1985 paper by Gilovich, Vallone, and Tversky collected evidence that contradicted this belief and showed that successive shots are independent events (http://psych.cornell.edu/sites/default/files/Gilo.Vallone.Tversky.pdf). This paper started a great controversy that continues to this day, as you can see by Googling hot hand basketball.
We do not expect to resolve this controversy today. However, in this lab we’ll apply one approach to answering questions like this. The goals for this lab are to (1) think about the effects of independent and dependent events, (2) learn how to simulate shooting streaks in R, and (3) to compare a simulation to actual data in order to determine if the hot hand phenomenon appears to be real.
DATA606 - Assignment 2
Homework 2 for Data 606
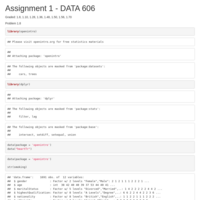
Assignment 3 - DATA607
Homework problems for assignment 3 - working with stringr
Lab1 - DATA606
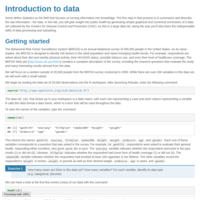
Some define Statistics as the field that focuses on turning information into knowledge. The first step in that process is to summarize and describe the raw information - the data. In this lab, you will gain insight into public health by generating simple graphical and numerical summaries of a data set collected by the Centers for Disease Control and Prevention (CDC). As this is a large data set, along the way you’ll also learn the indispensable skills of data processing and subsetting.
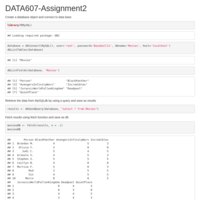
DATA607 - Assignment 2
Choose six recent popular movies. Ask at least five people that you know (friends, family, classmates, imaginary friends) to rate each of these movie that they have seen on a scale of 1 to 5. Take the results (observations) and store them in a SQL database. Load the information into an R dataframe.
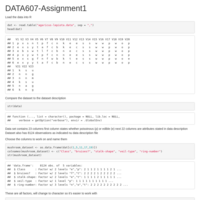
DATA607 - Assignment 1
Study the associated description of the data. Include 3-4 columns from the Mushrooms Dataset and add meaningful column names and replace the abbreviations used in the data.
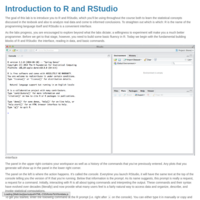
Lab0 - DATA 606
The goal of this lab is to introduce you to R and RStudio, which you'll be using throughout the course both to learn the statistical concepts discussed in the textbook and also to analyze real data and come to informed conclusions. To straighten out which is which: R is the name of the programming language itself and RStudio is a convenient interface.