Recently Published
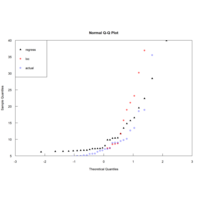
Normal Q-Q Plot
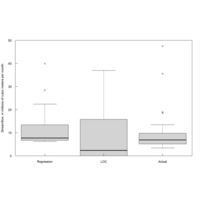
Streamflow relationship to Dam removal.
LOC estimates are a little closer to the actual measured streamflows than the regression
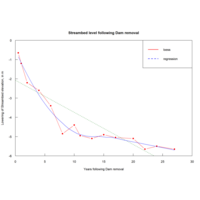
Loess of Streambed and Dam removal Plot
Abline is forest green dashed line. This is Exercise 10.3
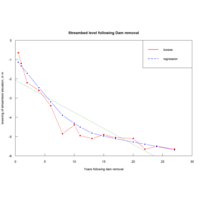
Regression of Bed Lowering Plot
Relationship between lowering of streambed and dam removal.
regression abline is displayed as forest green. The legend has the other information.
Linear Least squares Plot
Residuals:
Min 1Q Median 3Q Max
-1.44350 -0.49350 0.09426 0.44426 1.50413
Coefficients:
Estimate Std. Error t value Pr(>|t|)
(Intercept) -2.07064 0.38306 -5.405 0.00012 ***
Yrs -0.16698 0.02617 -6.381 2.41e-05 ***
---
Signif. codes: 0 ‘***’ 0.001 ‘**’ 0.01 ‘*’ 0.05 ‘.’ 0.1 ‘ ’ 1
Residual standard error: 0.8448 on 13 degrees of freedom
Multiple R-squared: 0.758, Adjusted R-squared: 0.7394
F-statistic: 40.72 on 1 and 13 DF, p-value: 2.414e-05
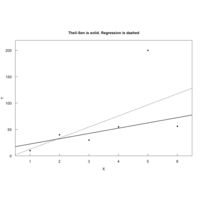
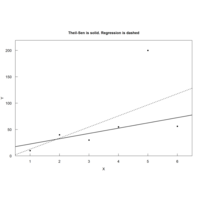
Theil-SEN Solid, regression is dashed Plot
Exercise 10.2 tau = 0.7333333. True Tau is NOT equal to zero.
%95 confidence level, LCL = -10 Theil slope = 10 UCL = 85
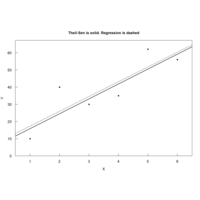
Theil-Sen Plot
Exercise 10.1
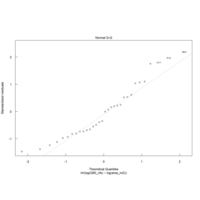
Normal Q-Q Plot 4
Drainage vs Increased streamflow.
So, variance of residuals does NOT vary with the fitted values and appear to follow a normal distribution. This model should mee the require assumptions.

Drainage Area and Q90 version 2 Plot
Using log transformation , to the y variable, we can observe a linear relationship. Although we now need to perform a bias correction to Q90 values. The bias correction needs to be performed to make sure no underestimation of the Observed Q90 values
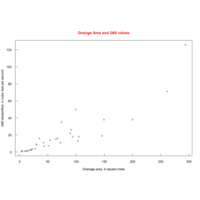
Streamflow and Q90 values Plot
Relation between drainage area and Q90 values.
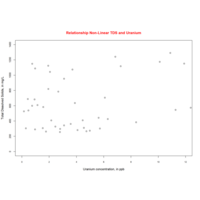
Non linear Plot
Relationship--Non-Linear--Totally Dissolved Solids & Uranium
Using Spearman's rank correlation I found out that there is a positive indication that High uranium concentrations tend to relate to TDS(Total Dissolved Solids). Although there is a WEAK relation given the Spearman's rho correlation coefficient (rho = 0.11).
However-----
Using Kendall's rank correlation tau
we can reject the null hypothesis that relationship between Uranium and TDS- is not significant.
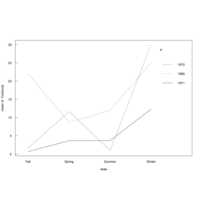
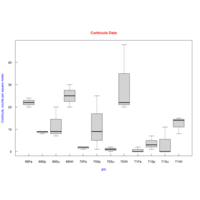
Corbicula Interaction Plot
Plotting seas with Corbicula data corresponding to years
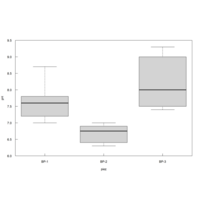
Shapiro-Wilk Normality Test
The Shapiro-Wilk Test was used for pH measurements in water. The ph
measurements were obtained by using a piezometer.
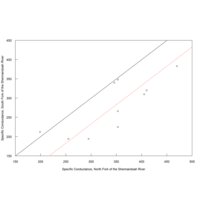
Hodges - Lehman difference plot
Hodges-Lehman is used as a estimation of conductance for the
Shennandoah River
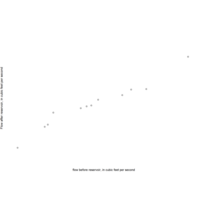
The Sen Plot
The Median of All Possible Ratios
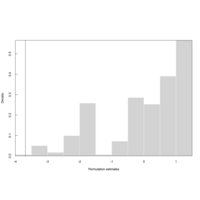
Permutation Test of Difference Between 2 Group Means
Data: downgradient and Up gradient . Tis is a two-sided alternative test
using the Wilcoxon rank sum test with continuity correction.
The vertical line represents the difference of the observed means. the rank and sum test; plus the permutation test on the means will find the difference in the two groups.

Boxplots of chloride concentration two rock types
Chloride concentration Grandiorite and Quartz Monozonite
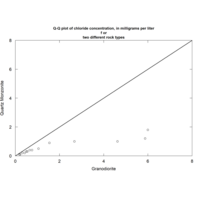
Q_Q_ Plot chloride concentration mg/l
this plot is for comparing two different rock types
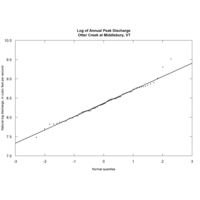
Log Plot Annual Peak Discharge
Logarithm Plot if Annual Peak Discharge at
Middlebury, VT
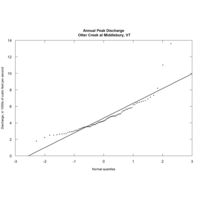
Quantilt Plot of Otter Creek Middlebury VT
quantile plot describing positive skewness
