
FinanceStudyGroup
FinanceStudyGroup
Recently Published
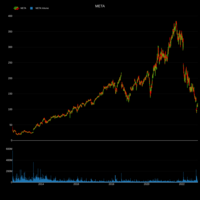
Meta Platforms, Inc. (NASDAQ: META)
Meta Platforms, Inc. (NASDAQ: META) as plotted in Plotly. Data sourced from Yahoo Finance, using R.
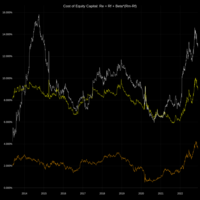
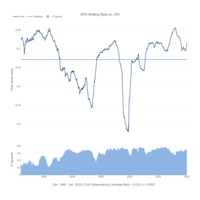
Cost of Equity (META, Based on 1Y Daily Beta)
This is the cost of equity capital (Re), determined using the Capital Asset Pricing Model, and time series data for the risk-free rate (Rf), beta, and the market rate of return (Rm), where Rm was calculated using Damodaran's method, automated in R on a time series basis.
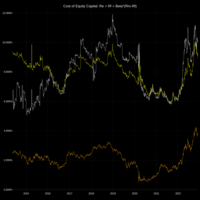
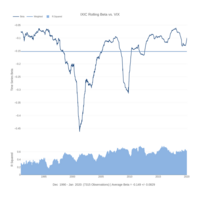
Cost of Equity (META, Based on 2Y Weekly Beta)
This is the cost of equity capital (Re), determined using the Capital Asset Pricing Model, and time series data for the risk-free rate (Rf), beta, and the market rate of return (Rm), where Rm was calculated using Damodaran's method, automated in R on a time series basis.
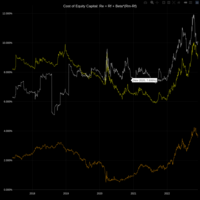
Cost of Equity (META, Based on 5Y Monthly Beta)
This is the cost of equity capital (Re), determined using the Capital Asset Pricing Model, and time series data for the risk-free rate (Rf), beta, and the market rate of return (Rm), where Rm was calculated using Damodaran's method, automated in R on a time series basis.
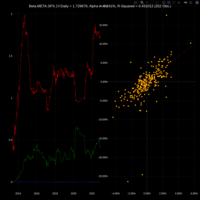
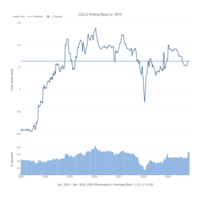
Beta.META.SPX.1Y.Daily
This is the 1-year, daily beta of Meta Platforms, Inc. (NASDAQ: META), with respect to the S&P 500.
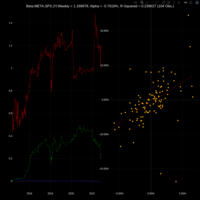
Beta.META.SPX.2Y.Weekly
This is the 2-year, weekly beta of Meta Platforms, Inc. (NASDAQ: META), with respect to the S&P 500.
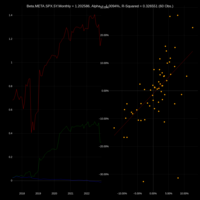
Beta.META.SPX.5Y.Monthly
This is the 5-year, monthly beta of Meta Platforms, Inc. (NASDAQ: META), with respect to the S&P 500.
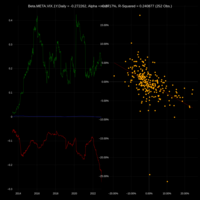
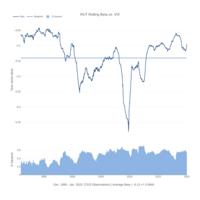
Beta.META.VIX.1Y.Daily
This is the 1-year, daily beta of Meta Platforms, Inc. (NASDAQ: META), with respect to the VIX.
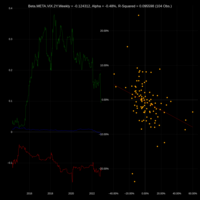
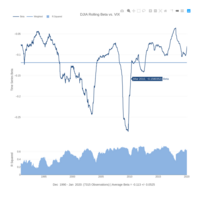
Beta.META.VIX.2Y.Weekly
This is the 2-year, weekly beta of Meta Platforms, Inc. (NASDAQ: META), with respect to the VIX.
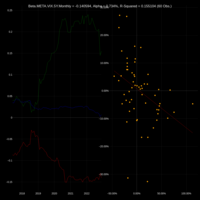
Beta.META.VIX.5Y.Monthly
This is the 5-year, monthly beta of Meta Platforms, Inc. (NASDAQ: META), with respect to the VIX.
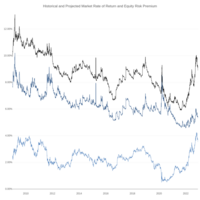
Market Rate of Return and Equity Risk Premium
Equity risk premium, as plotted in Plotly. Earnings forecasts sourced from Damodaran's work on the ERP.
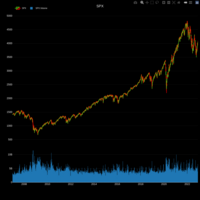
SPX
This is a plot of the S&P 500 (SPX) from 1/10/2007 to 12/01/2022.
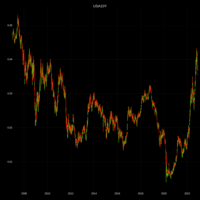
USA10Y
This plot is a decimal representation of the 10-Year Treasury yield, from 1/10/2007 to 12/01/2022.
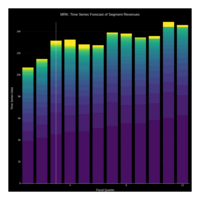
Time Series Forecast: Segment Revenue (NYSE: MRK)
Time series forecast of the segment revenues, of Merck & Co., Inc. (NYSE: MRK). Forecast as the average of additive and multiplicative time series forecasts, using data from 1Q15 to 3Q21. Forecasts run from 4Q21 to 4Q23.
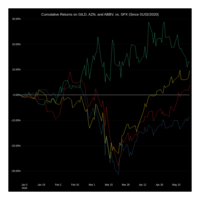
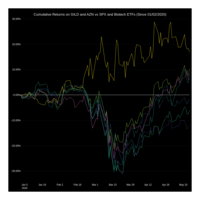
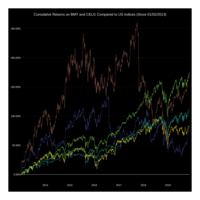
GILD, AZN, and ABBV, vs. SPX
Cumulative Returns on GILD, AZN, and ABBV, vs. SPX
GILD
Gilead Sciences, Inc. (NASDAQ: GILD), as plotted in Plotly. Data sourced from Yahoo Finance, using R.
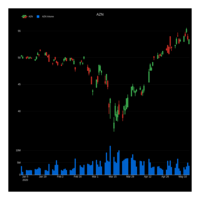
AZN
AstraZeneca PLC (NYSE: AZN), as plotted in Plotly. Data sourced from Yahoo Finance, using R.
GILD vs. AZN
Cumulative returns on Gilead Sciences, Inc. (NASDAQ: GILD) and AstraZeneca PLC (NYSE: AZN), plotted against the S&P 500. Data sourced from Yahoo Finance, using R.
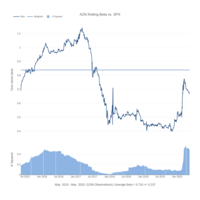
Beta.AZN.SPX
This time series describes the 1-year, daily, beta of AZN with respect to the S&P 500 index (^GSPC in Yahoo Finance), over a 5-year interval. Data were sourced from Yahoo Finance, using R.
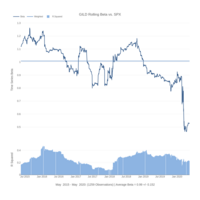
Beta.GILD.SPX
This time series describes the 1-year, daily, beta of GILD with respect to the S&P 500 index (^GSPC in Yahoo Finance), over a 5-year interval. Data were sourced from Yahoo Finance, using R.

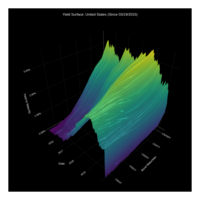
Yield Surface on US Bonds: Since 2009
Surface plot of the time series of the US yield curve.
Data sourced from Investing.com, using Selenium in Python.
Plotted with Plotly in R.
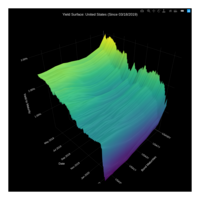
5-Year Yield Surface on US Bonds
Surface plot of the time series of the US yield curve.
Data sourced from Investing.com, using Selenium in Python.
Plotted with Plotly in R.
Last 12 Months' Yield Surface on US Bonds
Surface plot of the time series of the US yield curve.
Data sourced from Investing.com, using Selenium in Python.
Plotted with Plotly in R.
Beta.SPX.VIX
This time series describes the 1-year, daily, beta of the S&P 500 index (^GSPC in Yahoo Finance) with respect to the CBOE VIX (^VIX). Data were sourced from Yahoo Finance, using R.
Beta.IXIC.VIX
This time series describes the 1-year, daily, beta of the NASDAQ Composite Index (^IXIC) with respect to the CBOE VIX (^VIX). Data were sourced from Yahoo Finance, using R.
Beta.RUT.VIX
This time series describes the 1-year, daily, beta of the Russell 2000 index (^RUT) with respect to the CBOE VIX (^VIX). Data were sourced from Yahoo Finance, using R.
Beta.DJIA.VIX
This time series describes the 1-year, daily, beta of the Dow Jones Industrial Average (^DJI in Yahoo Finance) with respect to the CBOE VIX (^VIX). Data were sourced from Yahoo Finance, using R.
BMY and CELG Performance vs. Indices
Cumulative returns on Bristol-Myers Squibb and Celgene vs. the performance of US indices (SPX, DJIA, IXIC, RUT).
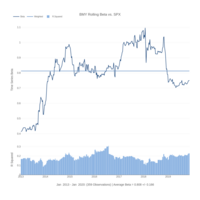
Beta.BMY.SPX
This time series describes the 2-year, weekly, beta of Bristol-Myers Squibb Company (NYSE: BMY) with respect to the S&P 500 (^SPX). Data were sourced from Yahoo Finance, using R.
Beta.CELG.SPX
This time series describes the 2-year, weekly, beta of Celgene Corporation (NASDAQ: CELG) with respect to the S&P 500 (^SPX). Data were sourced from Yahoo Finance, using R.
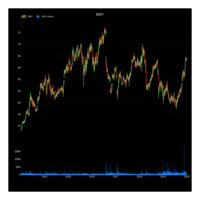
BMY
Bristol-Myers Squibb Company (NYSE: BMY), as plotted in Plotly. Data sourced from Investing.com, using selenium in Python.
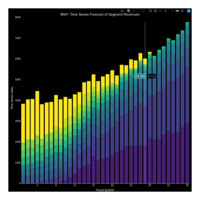
Time Series Forecast: Segment Revenue (NYSE: BMY)
Time series forecast of the segment revenues, of Bristol-Myers Squibb Company (NYSE: BMY). Forecast by the additive model of time series forecasting, using data from 1Q2013 to 3Q2019.
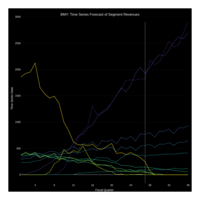
Time Series Forecast: Segment Revenue (NYSE: BMY)
Time series forecast of the segment revenues, of Bristol-Myers Squibb Company (NYSE: BMY). Forecast by the additive model of time series forecasting, using data from 1Q2013 to 3Q2019.
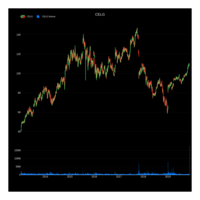
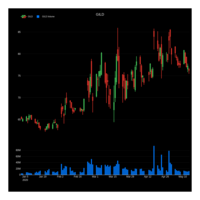
CELG
Celgene Corporation (NASDAQ: CELG), as plotted in Plotly. Data sourced from Investing.com, using selenium in Python.
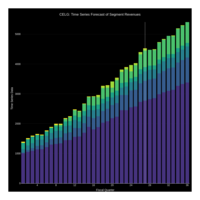
Time Series Forecast: Segment Revenue (NASDAQ: CELG)
Time series forecast of the segment revenues, of Celgene Corporation (NASDAQ: CELG). Forecast by the additive model of time series forecasting, using data from 1Q2013 to 3Q2019.
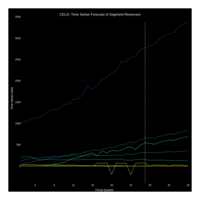
Time Series Forecast: Segment Revenue (NASDAQ: CELG)
Time series forecast of the segment revenues, of Celgene Corporation (NASDAQ: CELG). Forecast by the additive model of time series forecasting, using data from 1Q2013 to 3Q2019.
LVMH
LVMH MOËT HENNESSY LOUIS VUITTON SA (XPAR: MC), as plotted in Plotly. Data sourced from Investing.com, using selenium in Python.
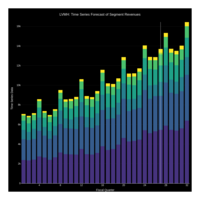
Time Series Forecast: Segment Revenue (XPAR: MC)
Time series forecast of the segment revenues, of LVMH Moët Hennessy Louis Vuitton SE (XPAR: MC). Forecast as the average of additive and multiplicative time series forecasts, using data from 1Q2013 to 3Q2019.
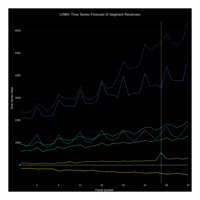
Time Series Forecast: Segment Revenue (XPAR: MC)
Time series forecast of the segment revenues, of LVMH Moët Hennessy Louis Vuitton SE (XPAR: MC). Forecast as the average of additive and multiplicative time series forecasts, using data from 1Q2013 to 3Q2019.
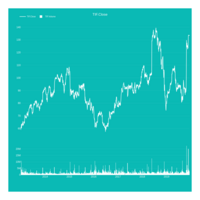
TIF
Tiffany & Co. (NYSE: TIF), as plotted in Plotly. Data sourced from Investing.com, using selenium in Python.
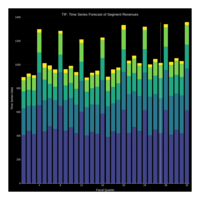
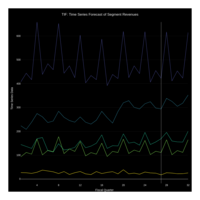
Time Series Forecast: Segment Revenue (NYSE: TIF)
Time series forecast of the segment revenues, of Tiffany & Co. (NYSE: TIF). Forecast as the maximum of additive and multiplicative time series forecasts, using data from 1Q2013 to 3Q2019.
Time Series Forecast: Segment Revenue (NYSE: TIF)
Time series forecast of the segment revenues, of Tiffany & Co. (NYSE: TIF). Forecast as the maximum of additive and multiplicative time series forecasts, using data from 1Q2013 to 3Q2019.
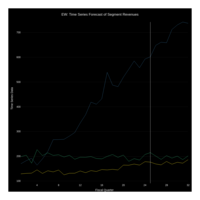
Time Series Forecast: Segment Revenue (NYSE: EW)
Time series forecast of the segment revenue, and total revenues, of Edwards Lifesciences Corporation (NYSE: EW). Multiplicative time series forecast, using data from 1Q2013 to 2Q2019.
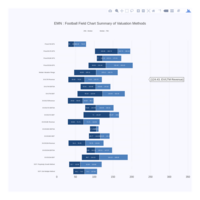
EMN Valuation (2/28/2017)
Business valuation of Eastman Chemical Company (NYSE: EMN). Historical data used to test system for football field chart summaries.
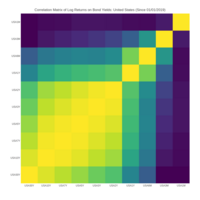
Correlation Matrix on US Bonds
Year to Date Correlation Matrix on US Bond Yields (YTM)
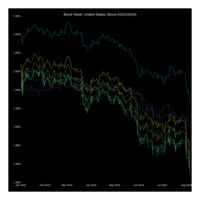
Time Series of US Bonds
Year to Date Time Series of US bond yields.
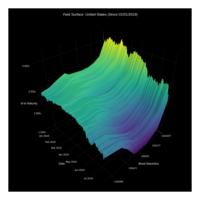
Year to Date Yield Surface on US Bonds
Year to date surface plot of the time series of the US yield curve.
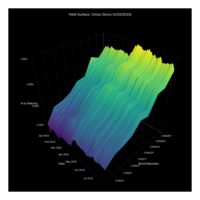
Year to Date Yield Surface on Chinese Bonds
Year to date surface plot of the time series of the Chinese yield curve.

Time Series of Chinese Bonds
Year to Date Time Series of Chinese bond yields.
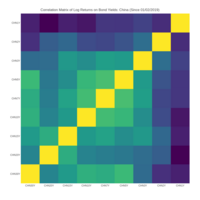
Correlation Matrix on Chinese Bonds
Year to Date Correlation Matrix on Chinese Bond Yields (YTM)
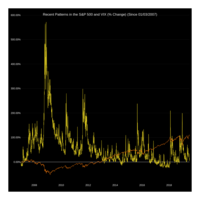
Recent Patterns in the S&P 500 and VIX
Cumulative returns on the S&P 500 and VIX since 01/03/2007, displaying the characteristic inverse relationship between the two.
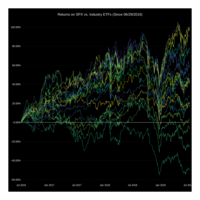
Returns on SPX vs. Industry ETFs
Cumulative returns on selected industry ETFs vs. the performance of the S&P 500 (SPX).
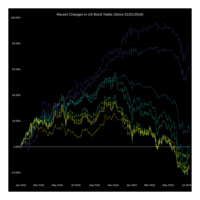
Recent Changes in US Bond Yields
Percent changes in bond yields.
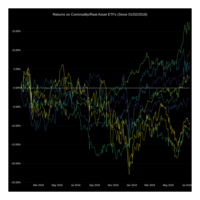
Returns on Commodity/Real Asset ETFs
Recent cumulative returns on selected commodity/real asset ETFs.
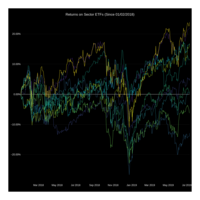
Returns on Sector ETFs
Recent cumulative returns on selected sector ETFs.