
GaryFH
Gary
Recently Published
Document
"Statistical inference with the GSS data" Duke Course 2 Peer-graded Assignment
BlodgettData GaryFH December 5, 2017
Data investigation for Phd project
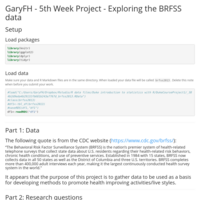
GaryFH - 5th Week Project - Exploring the BRFSS data
The following quote is from the CDC website (https://www.cdc.gov/brfss/):
“The Behavioral Risk Factor Surveillance System (BRFSS) is the nation’s premier system of health-related telephone surveys that collect state data about U.S. residents regarding their health-related risk behaviors, chronic health conditions, and use of preventive services. Established in 1984 with 15 states, BRFSS now collects data in all 50 states as well as the District of Columbia and three U.S. territories. BRFSS completes more than 400,000 adult interviews each year, making it the largest continuously conducted health survey system in the world.”

Capstone Project Final Project Presentation
Data Science Capstone
by Johns Hopkins University
Presented by Coursera
DocumentCapstone Week2 Text Mining/n-grams
Load “en_US.blogs.txt”, “en_US.news.txt”, “en_US.twitter.txt” into the R work environment. N-grams of texts are extensively used in text mining and natural language processing tasks. They are basically a set of co-occuring words within a given window - I will use RWeka to create ngrams with NGramTokenizer
Developing Data Products week 4 presentation
peer review project
Developing Data Products Week 3
Peer review assignment
Developing Data Products Week 2 Assignment
Week 2 peer review assignment
Practical Machine Learning Course Project
Using devices such as Jawbone Up, Nike FuelBand, and Fitbit it is now possible to collect a large amount of data about personal activity relatively inexpensively. These type of devices are part of the quantified self movement – a group of enthusiasts who take measurements about themselves regularly to improve their health, to find patterns in their behavior, or because they are tech geeks. One thing that people regularly do is quantify how much of a particular activity they do, but they rarely quantify how well they do it. In this project, your goal will be to use data from accelerometers on the belt, forearm, arm, and dumbell of 6 participants. They were asked to perform barbell lifts correctly and incorrectly in 5 different ways. More information is available from the website here: http://groupware.les.inf.puc-rio.br/har (see the section on the Weight Lifting Exercise Dataset).
RegressionModelsCourseWeek4Project
You work for Motor Trend, a magazine about the automobile industry. Looking at a data set of a collection of cars, they are interested in exploring the relationship between a set of variables and miles per gallon (MPG) (outcome). They are particularly interested in the following two questions:
1) “Is an automatic or manual transmission better for MPG”
2) "Quantify the MPG difference between automatic and manual transmissions"
OPTIONALRegression-practice
“We are conducting research on the ways that people use data analysis and data science tools. Your participation in this non-graded and completely optional peer assessment will be part of that research. We will not collect any personally identifiable information about you for the purposes of this research and only aggregated totals of responses to questions will be reported. The potential risks to you are small. The potential benefits to the community of data scientists, developers, and professors are very high – we will be able to figure out which methods work and which methods do not. This exercise is 100% optional and will not have any influence whatsoever on your grade in the class. Thanks for considering helping us learn about data science!”
Statistical Inference Project
This project has two parts:
Part 1: Simulation Exercise Instructions
In this project you will investigate the exponential distribution in R and compare it with the Central Limit Theorem. The exponential distribution can be simulated in R with rexp(n, lambda) where lambda is the rate parameter. The mean of exponential distribution is 1/lambda and the standard deviation is also 1/lambda. Set lambda = 0.2 for all of the simulations. You will investigate the distribution of averages of 40 exponentials. Note that you will need to do a thousand simulations.
Part 2: Basic Inferential Data Analysis
In the second portion of the project, we’re going to analyze the ToothGrowth data in the R datasets package.
JaredData1
Two tests were conducted to observe the correlation between bandwidth and temperature over time. 04/19/2017
Storm Data Analysis of National Weather Service Data
Storms and other severe weather events can cause both public health and economic problems for communities and municipalities.
This project involves exploring the U.S. National Oceanic and Atmospheric Administration’s (NOAA) storm database. This database tracks characteristics of major storms and weather events in the United States.
This project attemps to answer two questions:
1) Across the United States, which types of events (as indicated in the “EVTYPE” variable) are most harmful with respect to population health?
2) Across the United States, which types of events have the greatest economic consequences?