
Melkiades
Davide
Recently Published
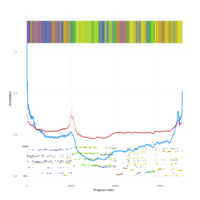
SAPPHIRE in Water (Hydrology data from Portland)
Here it is shown a dynamic version of the SAPPHIRE plot. You can zoom in and move around and fancy stuff. This case is an example in which you have different years and various controlled hydrological variables (e.g. water flow, temperature). Here the summer is highlighted in green-yellow while the winter is blueish.