
habiba_quadri
habiba
Recently Published
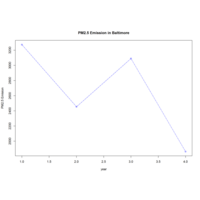
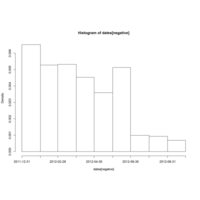
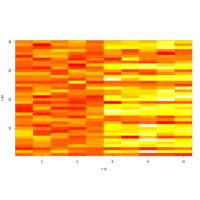
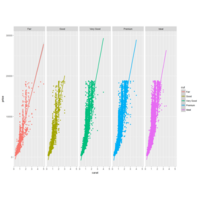
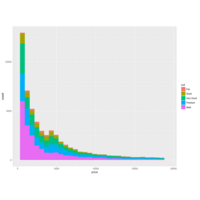
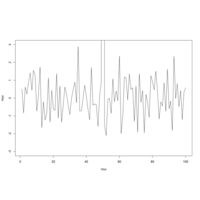
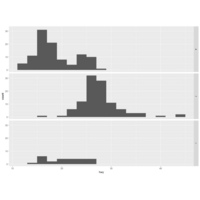
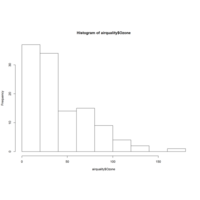
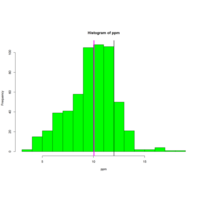
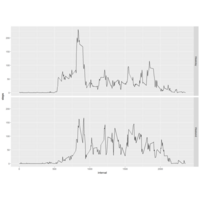
Plot of pm2.5 emission in years
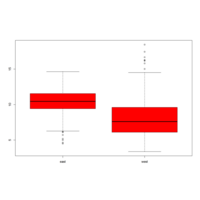
exploratory data analysis

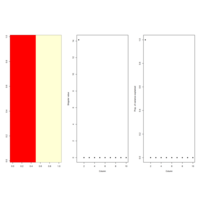
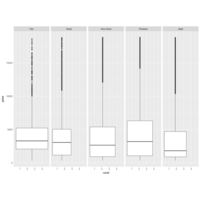

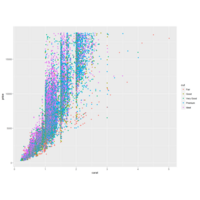
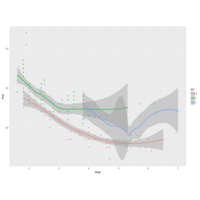
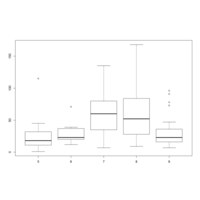


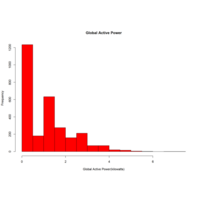
Plot1
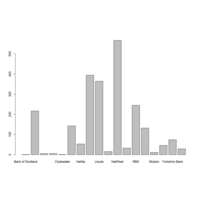
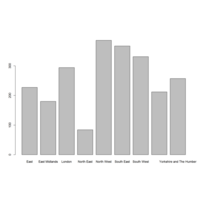
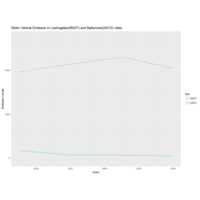
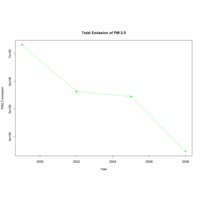
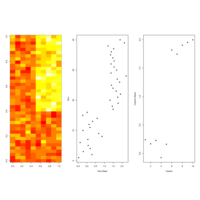
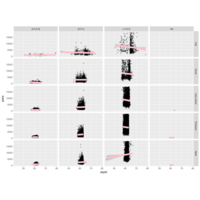
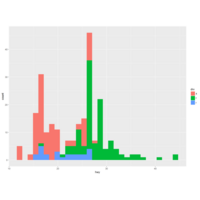
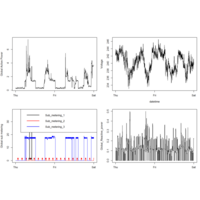
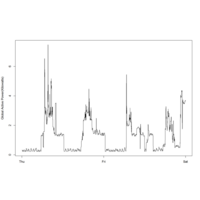
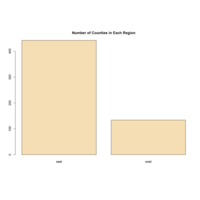
electricity data graph 1
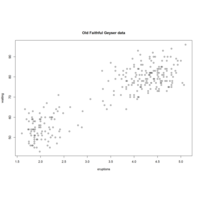
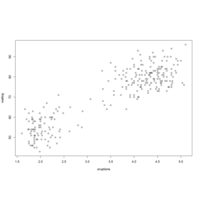
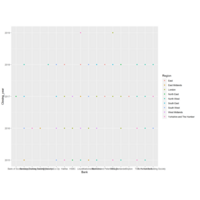
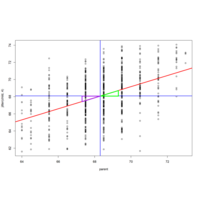
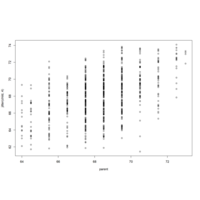
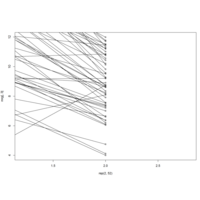
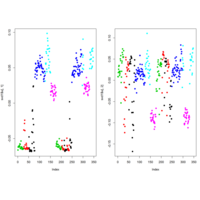
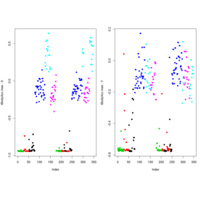
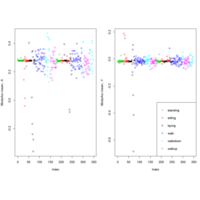
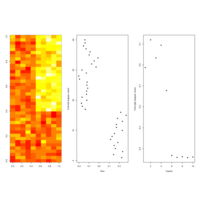
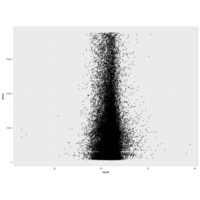
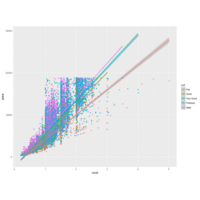
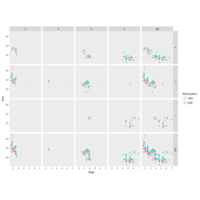
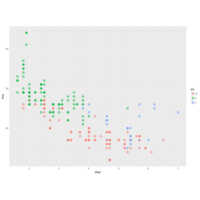
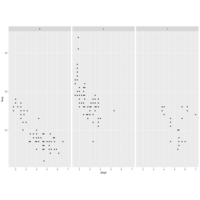
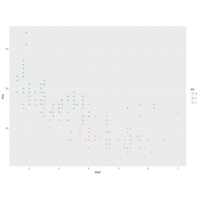
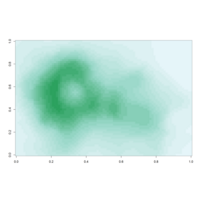
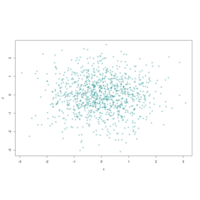
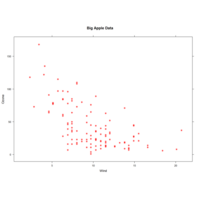
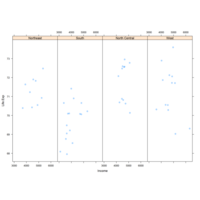
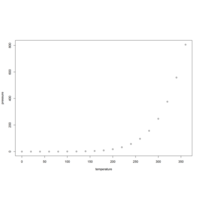
Plot_scatterplot
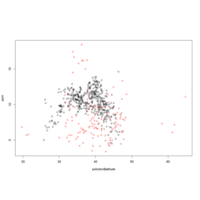
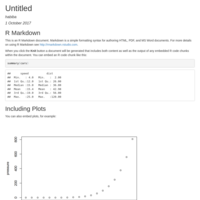
e've seen that we can use a function call as an argument when calling another function. We'll do this again when we call plot with the arguments
| latitude and pm25 which are both from our data frame pollution. We'll call plot from inside the R command with which evaluates "an R expression in
| an environment constructed from data". We'll use pollution as the first argument to with and the call to plot as the second. This allows us to avoid
| typing "pollution$" before the arguments to plot, so it saves us some typing and adds to your base of R knowledge. Try this now.
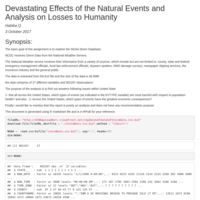
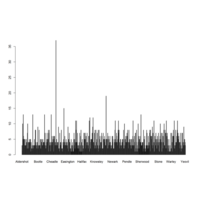
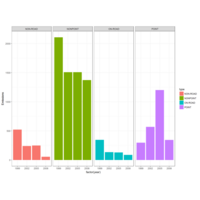
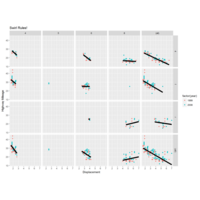
Storm Data Devastation Analysis
The project requires us to analyse the data set and produce the analysis regarding the natural event that result in major injuries/ fatalities and major damage in terms of cost/economy.
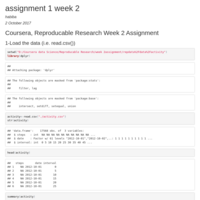
assignment 1 week 2 rep research complete
week 2 first assignment
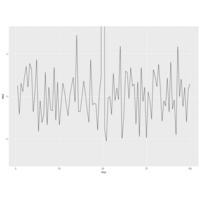
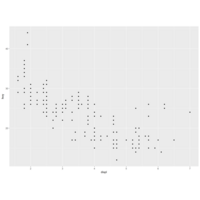
Plot
assignment 2 week 2 reproducable research
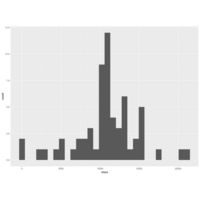
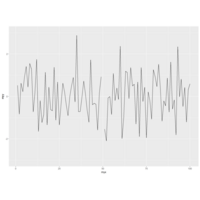
Plot 2 assignment week k2
reproducable reserach
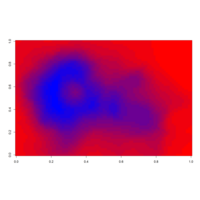
Plot
reproducable reaearch assignment week 2 plot
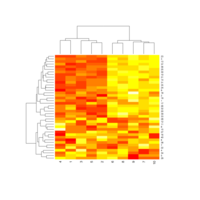
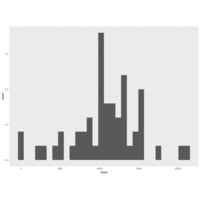
first html document
my first html R document
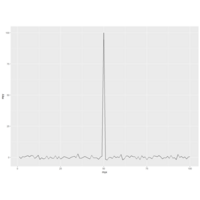
Plot
html plot