
jhooge
Jens Hooge
Recently Published
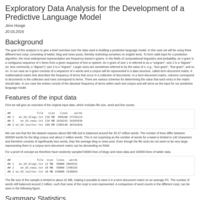
Exploratory Data Analysis for the Development of a Predictive Language Model
The goal of this analysis is to give a brief overview over the data used in building a predictive language model.
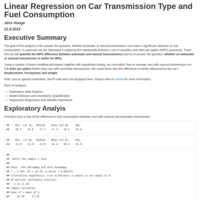
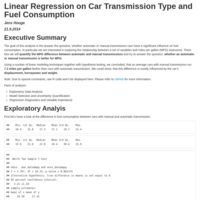
Linear Regression on Car Transmission Type and Fuel Consumption
The goal of this analysis is tho answer the question, whether automatic or manual transmission cars have
a significant influence on fuel consumption. In particular we are interested in exploring the relationship
between a set of variables and miles per gallon (MPG) (outcome). There fore we will
quantify the MPG
difference between automatic and manual transmissions
and try to answer the question,
whether
an automatic or manual transmission is better for MPG.
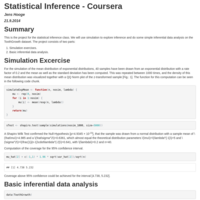
Statistical Inference
This is the project for the statistical inference class. We will use simulation
to explore inference and do some simple inferential data analysis on the
ToothGrowth dataset.
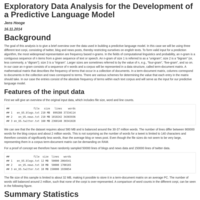
Exploratory Data Analysis for the Development of a Predictive Language Model
The goal of this analysis is to give a brief overview over the data used in building
a predictive language model.
Linear Regression on Car Transmission Type and Fuel Consumption
The goal of this analysis is tho answer the question, whether automatic or
manual transmission cars have a significant influence on fuel consumption. In particular we are interested in exploring the relationship between a set of
variables and miles per gallon (MPG) (outcome). There fore we will quantify
the MPG difference between automatic and manual transmissions and try to
answer the question, whether an automatic or manual transmission is better for
MPG.

Mixture Modeling for Model-Based Clustering
This tool has been created as part of the Coursera Course "Developing Data Products". It uses Mixtures of Gaussians for a Model Based Cluster analysis of the Pima Indian Diabetes Database. Up to ten components can be chosen for the mixtures.
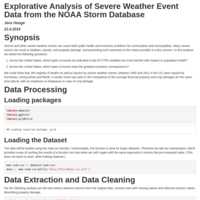
Explorative Analysis of Severe Weather Event Data from the NOAA Storm Database
Storms and other severe weather events can cause both public health and economic problems for communities and municipalities. Many severe events can result in fatalities, injuries, and property damage, and preventing such outcomes to the extent possible is a key concern. In this analysis I asked the following questions:
1. Across the United States, which types of events (as indicated in the EVTYPE variable) are most harmful with respect to population health?
2. Across the United States, which types of events have the greatest economic consequences?
I could show that, the majority of deaths as well as injuries by severe weather events, between 1950 and 2011 in the US, were caused by hurricanes, strong winds and floods. A similar result was seen in the comparison of the average financial property and crop damages for the same time inteval, with an emphasis on heatwaves in case of crop damage.
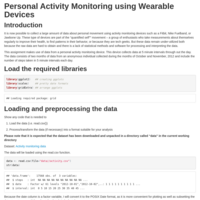
Personal Activity Monitoring using Wearable Devices
It is now possible to collect a large amount of data about personal movement using activity monitoring devices such as a Fitbit, Nike Fuelband, or Jawbone Up. These type of devices are part of the "quantified self"" movement – a group of enthusiasts who take measurements about themselves regularly to improve their health, to find patterns in their behavior, or because they are tech geeks. But these data remain under-utilized both because the raw data are hard to obtain and there is a lack of statistical methods and software for processing and interpreting the data.
In this report I analysed data from an anonymous individual collected during the months of October and November, 2012. Each day the number of steps have been measured in 5 minute intervals.
Questions adressed:
1. What is mean total number of steps taken per day?
2. What is the average daily activity pattern?
3. Are there differences in activity patterns between weekdays and weekends?