jsteinhart
Jonathan Steinhart
Recently Published
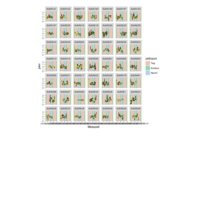
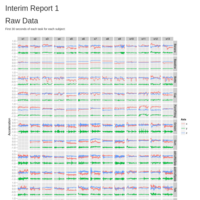
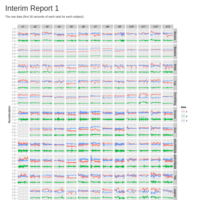
PWV Plots of ISAR data
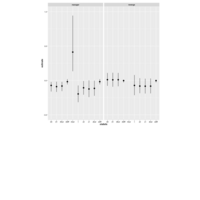
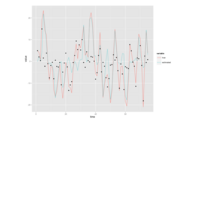
Time series plots of PWV for the 49 individuals in the ISAR sample who had the most observations. Raw data are in black, smoothed lines are yellow, and background colors show time of day. Times were shifted to a common day, each subject's data were demeaned, for better comparison.