
mikesilva
Michael Silva
Recently Published
DATA 608 Exploratory Data Analysis
Exploratory data visualization with R
Total Arcade Revenue and the Number of PhD Computer Science Graduates
A tong in cheek regression analysis of an interesting spurious correlation.
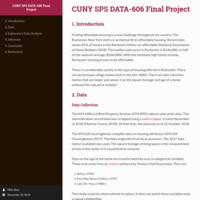
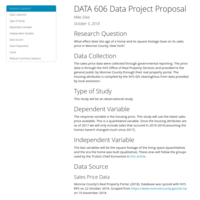
CUNY DATA 606 - Final Project
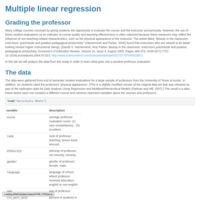
This study set out to see if the size of a home and the era in which it was built could be used to get an estimate of the sale price. While these variables seem to be relevant, predictions made only using the variables are largely inaccurate. It appears that the relationship is more complicated
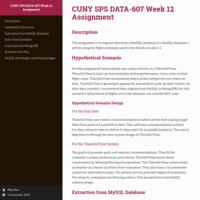
CUNY SPS DATA-607 Week 12 Assignment
MySQL to NoSQL (MongoDB) Migration Exercise
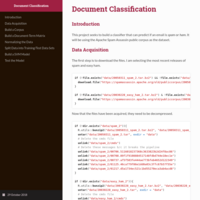
Document Classifier Project
Is the email message spam or ham? This SVM can help
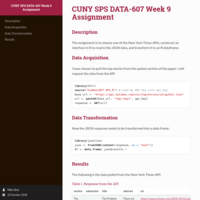
CUNY DATA 607 - Week 9 Assignment
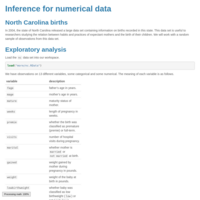
The assignment is to choose one of the New York Times APIs, construct an interface in R to read in the JSON data, and transform it to an R dataframe.
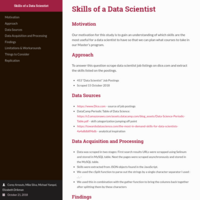
Skills of a Data Scientist
Our motivation for this study is to gain an understanding of which skills are the most useful for a data scientist to have so that we can plan what courses to take in our Master’s program. We scraped 453 job postings from Dice.com. The top skills include: Python, Machine Learning, Data Analysis, SQL and R.
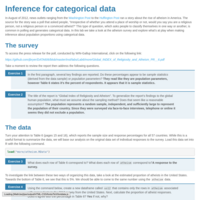
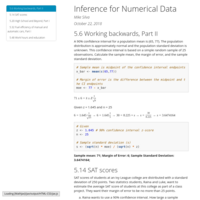
CUNY SPS DATA 606 Lab 4a
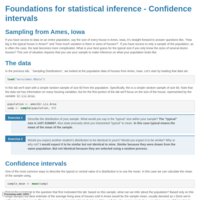
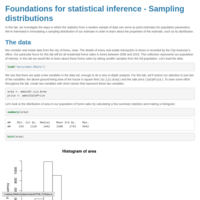
Foundations for statistical inference - Sampling distributions
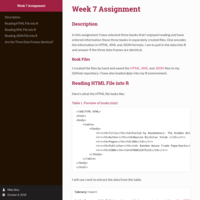
DATA 607 - Week 7 Assignment
In this assignment I have selected three books that I enjoyed reading and have entered information these three books in separately created files. One encodes the information in HTML, XML and JSON formats. I am to pull in the data into R and answer if the three data frames are identical.
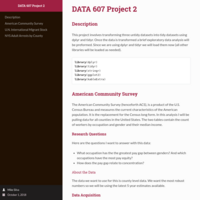
DATA 607 Project 2
Creating 3 tidy data sets
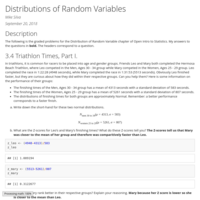
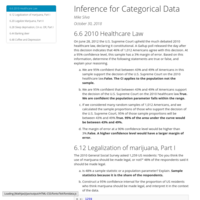
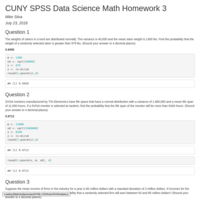
CUNY SPS DATA 606 Distributions of Random Variables
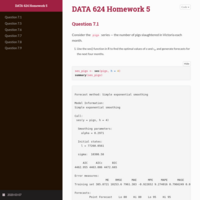
Graded problems for the OpenIntro Statistics chapter on Distributions of Random Variables. My answers to the questions are in bold.
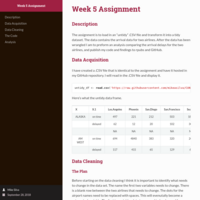
CUNY SPS DATA 607 Week 5 Assignment
Analysis of two airlines arrival ratings for five airports
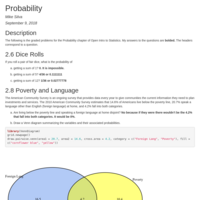
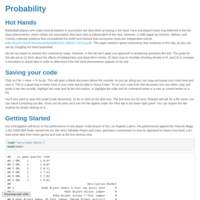
CUNY SPS DATA 606 Probability
Graded problems for the Intro to Data chapter of Probability. My answers to the questions are in bold.
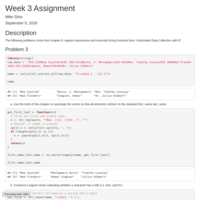
CUNY SPS DATA-607 Week 3 Assignment
A little fun with regular expressions.
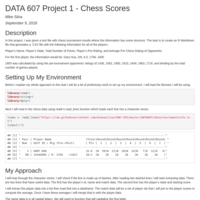
CUNY SPS DATA-607 Project 1
This project extracts player information from a semi-structured text file.

Hands on Lab 2-3: Combining Data from Multiple Sources
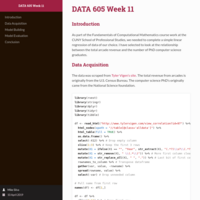
Your task is to create an R dataframe that shows rates of tuberculosis infection by country. You should use the information from the tb database and the attached population.csv file. Your R dataframe should have the following columns: Country, Year, Rate (Where Rate is defined as Cases/Population).
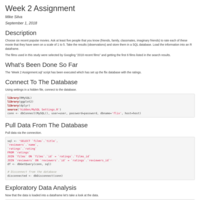
CUNY SPS DATA-607 Week 2 Assignment
Choose six recent popular movies. Ask at least five people that you know (friends, family, classmates, imaginary friends) to rate each of these movie that they have seen on a scale of 1 to 5. Take the results (observations) and store them in a SQL database. Load the information into an R dataframe.
The films used in this study were selected by Googling “2018 recent films” and getting the first 6 films listed in the search results.
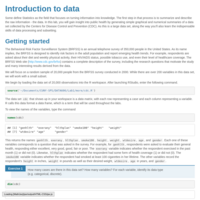
CUNY SPS DATA-606 Lab 1
Introduction to Data
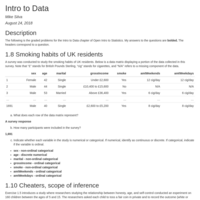
CUNY SPS DATA 606 Intro to Data
Graded problems for the Intro to Data chapter of Open Intro to Statistics. My answers to the questions are bolded.
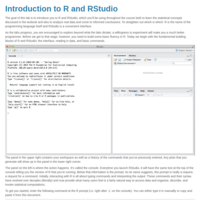
CUNY SPS DATA-606 Lab 0
Introduction to R and RStudio
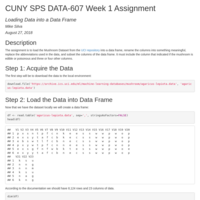
CUNY SPS DATA-607 Week 1 Assignment
The assignment is to load the Mushroom Dataset from the UCI repository into a data frame, rename the columns into something meaningful, replace the abbreviations used in the data, and subset the columns of the data frame. It must include the column that indicated if the mushroom is edible or poisonous and three or four other columns.
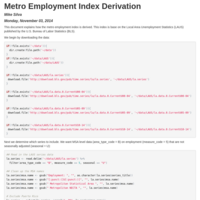
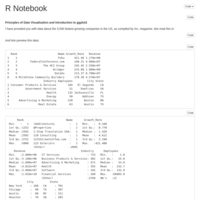
Metro Employment Index
This document explains how the metro employment index is derived. This index is base on the Local Area Unemployment Statistics (LAUS) published by the U.S. Bureau of Labor Statistics (BLS). It is seasonally adjusted using the Loess seasonal decomposition method.
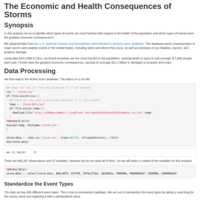
The Economic and Health Consequences of Storms
This analysis was preformed as part of Coursera's Reproducible Research course.