Recently Published
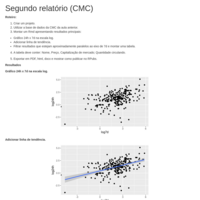
relatorio 2
aula de programação em R
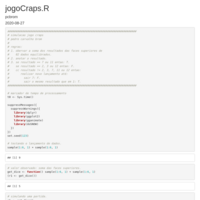
Craps
Simulando o jogo craps.

Predict Next Word - Presentation
This presentation will briefly but comprehensively pitch an application for predicting the next word. The application is the capstone project for the Coursera Data Science specialization held by professors of the Johns Hopkins University and in cooperation with SwiftKey.
Aspects of geometry for some species of fish
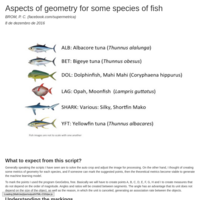
Generally speaking the scripts I have seen are to solve the auto crop and adjust the image for processing. On the other hand, I thought of creating some metrics of geometry for each species, and if someone can mark the suggested points, then the theoretical metrics become viable to generate the machine learning model.
To mark the points I used the program GeoGebra, free. Basically we will have to create points A, B, C, D, E, F, G, H and I to create measures that do not depend on the order of magnitude. Angles and ratios will be created between segments. The angle has an advantage that its unit does not depend on the size of the object, as well as the reason, in which the unit is canceled, generating an association rate between the objects.

Exploratory Data Analysis - Capstone
The original database contains more than 4,269,678 lines of information distributed in news, blogs and twitts in the English language. The full database preprocessing took about 20 minutes using a notebook with an Intel i3 processor, 8 GB RAM and 54 GB swap, Debian Jessie 8.6 operating system, RStudio version Version 1.0.44 and R version 3.3.2 , “Sincere Pumpkin Patch”.

Prediction of fake news by machine learning
In this repository you will find the code for creating the Shiny application of false vs. True. There are only two files ui.R and server.R, which serve to evaluate how the page was built. The predictive model links have been removed since the project is limited only to running a Shiny application.

OXL - Facebook - Perfil de publicação dos usuários.
O que foi avaliado?
1. Vendas por geolocalização.
2. Quantidade e valor total dos anúncios vs. medida de tempo.
3. Avaliação visual da intensidade de uso da comunidade.
4. Visão geral.

Map of violence in Brazil - 2012
The database is from the site [Where I was stolen] (http://www.ondefuiroubado.com.br/), dated of 2012. Clustering was done by type of criminal practice and the text informs the type of object that was stolen.
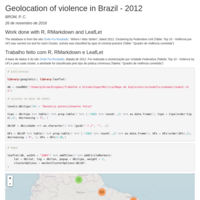
Geolocation of violence in Brazil - 2012
A base de dados é do site Onde Fui Roubado, datada de 2012. Foi realizada a clusterização por Unidade Federativa (Tabela: Top 10 - Violence by UF) e para cada cluster, a atividade foi classificada pelo tipo de prática criminosa (Tabela: “Quadro de violência cometida”)
NOAA Storm Data Base - Simple Data Analysisment
NOAA Storm Data Base - Simple Data Analysisment
Activity Monitoring Data
This assignment makes use of data from a personal activity monitoring device. This device collects data at 5 minute intervals through out the day. The data consists of two months of data from an anonymous individual collected during the months of October and November, 2012 and include the number of steps taken in 5 minute intervals each day.
Vehicle Performance Analysis
You work for Motor Trend, a magazine about the automobile industry. Looking at a data set of a collection of cars, they are interested in exploring the relationship between a set of variables and miles per gallon (MPG) (outcome). They are particularly interested in the following two questions:
“Is an automatic or manual transmission better for MPG”
“Quantify the MPG difference between automatic and manual transmissions”
Classification model with Random Forest using fine-tuning.
# Steps Taken
# 1. Tidy data. Remove columns with little/no data.
# 2. Create Training and test data from training data for cross validation checking.
# 3. Trial one method only: Random Forrest using Train Control Method "cv"
# and number of re-sampling 25.
# 4. Fine tune model through combinations of above methods, reduction of input variables or similar. The fine tuning will take into account accuracy first and speed of analysis second.
