
victorsalda
Victor Saldaña
Recently Published
Capstone Project Presentation
This is the presentation to pitch the shiny app that will be used to predict the next word after typing a sentence.
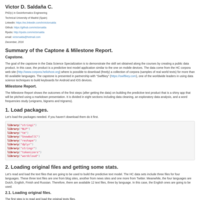
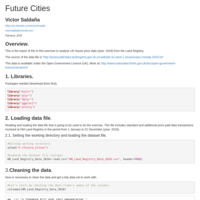
NLP: Milestone Report
The Milestone Report shows the outcomes of the first steps (after getting the data) on building the predictive text product that is a shiny app that will be pitched using a markdown presentation. It is divided in eight sections including data cleaning, an exploratory data analysis, and a word frequencies study (unigrams, bigrams and trigrams).

Web App: Reproducible Pitch Presentation
This presentation is part of the Peer-graded Assignment: Course Project: Shiny Application and Reproducible Pitch. The goal is to pinch the Web App. It has five slides including the first one and this one. It starts with a summary of the Web App follow by a description of it and, finally, an example of its code.
R Markdown & Plotly
This is a R Markdown presentation that features a plot created with Plotly package.

R Markdown & Plotly
This is the report of the design of a web page using R Markdown that features a plot created with Plotly package. The "airquality" data set is going to be use
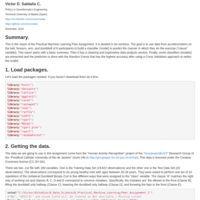
R Markdown & Leaflet
This is the report ofor the creating a web page using R Markdown that features a map created with Leaflet.
Practical Machine Learning Peer Assignment
This is the report of the Practical Machine Learning Peer Assignment. It is divided in six sections. The goal is to use data from accelerometers on the belt, forearm, arm, and dumbbell of 6 participants to build a classifier (model) to predict the manner in which they did the exercise (the "classe" variable(.
Statistical Inference Peer Assignment 2: Basic inferential data analysis
This is the report of the second part of the Statistical Inference Peer Assignment: Basic inferential data analysis. It includes supporting material such as the codes and figures.
Statistical Inference Peer Assignment 1: A simulation exercise
This is the report of the first part of the Statistical Inference Peer Assignment: A simulation exercise. It includes supporting material such as the codes and figures.
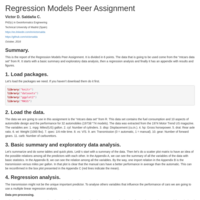
Regression Models Peer Assignment
This is the report of the Regression Models Peer Assignment. It is divided in 6 points. The data that is going to be used come from the “mtcars data set” from R. It starts with a basic summary and exploratory data analysis, then a regression analysis and finally it has an appendix with results and figures.
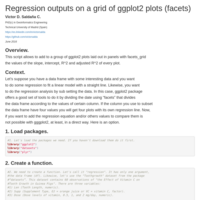
Add regression outouts to a grid of ggplot2 plots
This script allows to add to a group of ggplot2 plots laid out in panels with facets_grid the values of the slope, intercertpt, R^2 and adjusted R^2 of every plot.