
Zahidasghar
Zahid Asghar
Recently Published


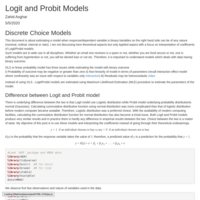
Frisch-Waugh Theorem with R Replications
What is Frisch Waugh theorem?
What is meaning of holding other variables constant
Partialing out, Neting out…
A practical example to understand the concept
Tax collection forecast for 12 months ahead: A tutorial
This is a tutorial for a course I am teaching in Economic Forecasting and I have used tax collection data for Pakistan to model trend and seasonal components besides comparing performance of various models.
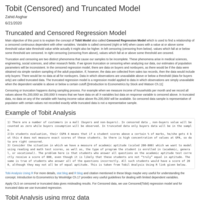
Dummy Variable Trap Example Using
If there is an intercept in the regression model, the number of dummy variables must be one less than the number of classifications of each qualitative variable.
If you drop the (common) intercept from the model, you can have as many dummy variables as the number of categories of the dummy variable.
The coefficient of a dummy variable must always be interpreted in relation to the reference category.
Video Link is https://youtu.be/LF_lmaT_pLU
Dummy variables can interact with quantitative regressors as well as with qualitative regressors. If a model has several qualitative variables with several categories, introduction of dummies for all the combinations can consume a large number of degrees of freedom.

Multicollinearity
MC is data issue, some moderate level of MC must be in the model
Force economic theory on data
Use Principal Components careful

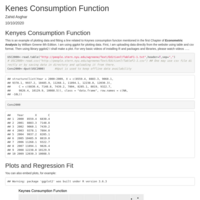
Robust Inference about the Art Market
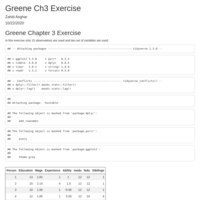
This is an example 4.5 given in Econometric Analysis by William Greene which is replicated using R
Hetroscedasticity in a Single Click
Hetroscedastic Corrected Standard Errors
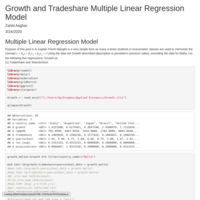
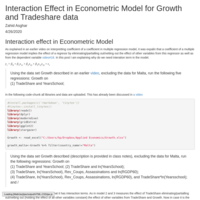
Multiple Linear Regression for Growth Data
Case 2 for Applied Economics
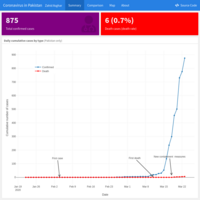
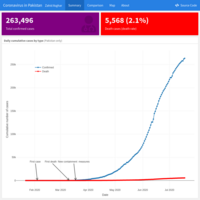
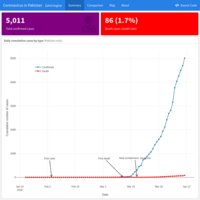
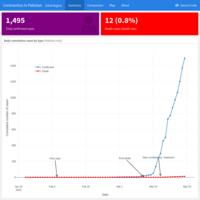
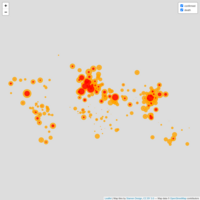
Covid-19 Dashboard for Pakistan
This dashboard is based on coronavirus data at a daily frequency
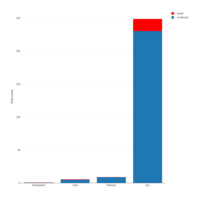
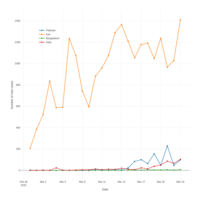
Covid-19 for Pakistan
India and Bangladesh has very low prevalance rate of Corona so far if number of cases per million population are taken into account.
Document R Codes for Videos 4 to 9
https://www.youtube.com/c/datavisualizationandanalytics_ZahidAsghar
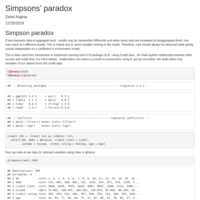
Simpson Paradox in econometric model
This is an example from moderndive.com for understanding Simpson's paradox.
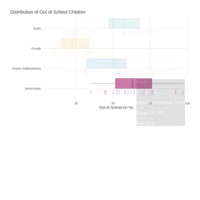
Labour Force Survey Data for Pakistan
Simple data wrangling and visualization
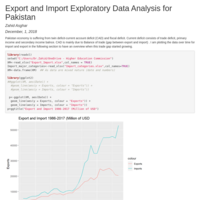
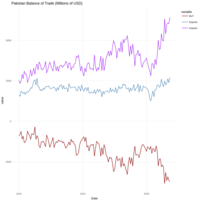
Pakistan Trade Deficit Exploratory Data Analysis
An overview of Balance of Trade
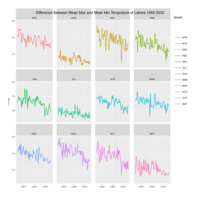
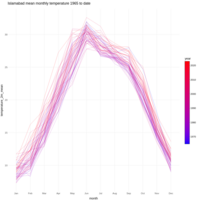
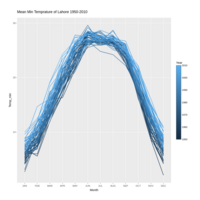
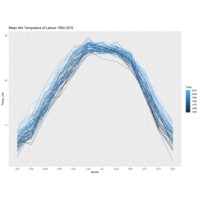
Temprature on Rise in Lahore 1950-2010
Difference between Mean maximum and Mean Minimum Temprature over the past 60 years indicate that there is decreasing trend between this range. There an indication that mean minimum temperature over time has increased and mean maximum temperature has remained more or less at same level. One uses diurnal range for daily max and minimum temperature for assessing weather conditions. Smaller the diurnal range is, warmer is the weather (if maximum temperature has not shifted downward). For example if Lahore has maximum temperature 44 and minimum 30 degree celcius while Islamabad has maximum 44 while minimum is 20 , Islamabad will have shorter duration of warm weather than Lahore as per my understanding
Line Chart with The Economist and Fivethirtyeight themes
This is a Markdown document with themes used : The Economist and Fivethirty
Publish HTML
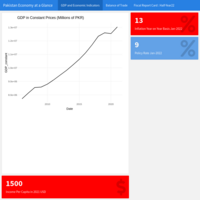
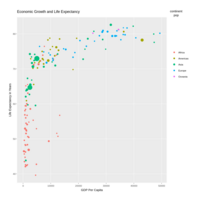
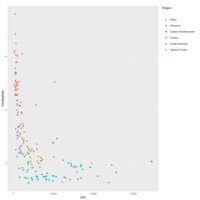
Fertility Rate vs Gross National Income
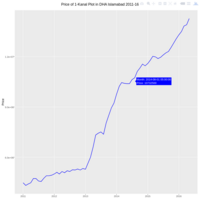
1-Kanal Plots prices over time
Source: Zameen.com