dgolicher
Duncan Golicher
Recently Published
Replication of the Met Office prediction of CO2 concentrations in 2023
https://www.metoffice.gov.uk/research/climate/seasonal-to-decadal/long-range/forecasts/co2-forecast


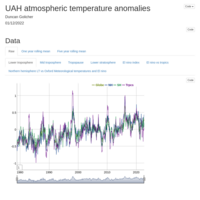
UAH atmospheric temperature anomalies
https://www.nsstc.uah.edu/climate/
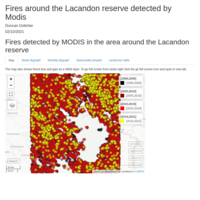
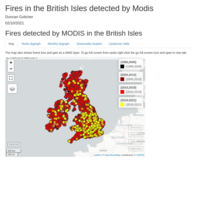
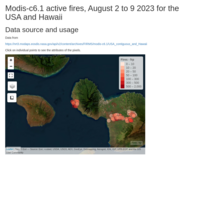
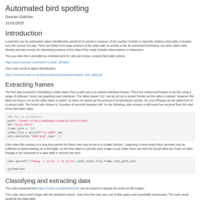
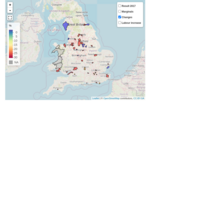
Fires in the British Isles
Fires detected by Modis from 2000 to 2020


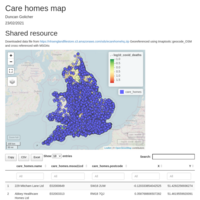
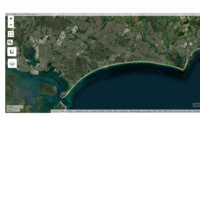
Care homes georeferenced
Work in progress. To be linked to other analyses


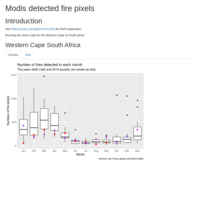
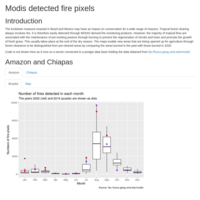
Modis fire points
Fires plotted as kernel densities


Births deaths and migration in the USA 2011 to 2019
A quick analysis of census data
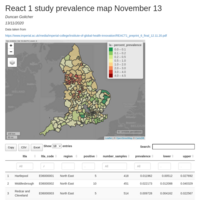
React one prevalence map
Data from
https://www.imperial.ac.uk/media/imperial-college/institute-of-global-health-innovation/REACT1_preprint_6_final_12.11.20.pdf
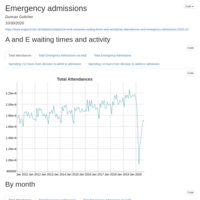
Admissions to accident and emergency (A&E) England
https://www.england.nhs.uk/statistics/statistical-work-areas/ae-waiting-times-and-activity/ae-attendances-and-emergency-admissions-2020-21/

STFM mortality data for key countries
Data from https://www.mortality.org/Public/STMF/Outputs/stmf.csv
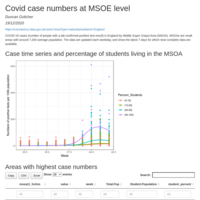
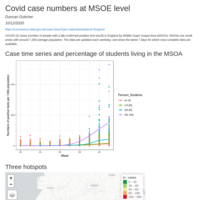
Update case numbers at MSOE level
Covid case numbers at MSOE level
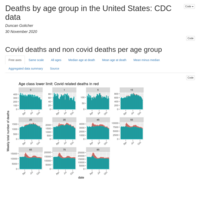
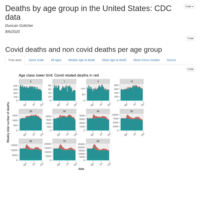
Ages of deaths reported by the USA CDC
Data from https://data.cdc.gov/NCHS/Provisional-COVID-19-Death-Counts-by-Sex-Age-and-W/vsak-wrfu
Case numbers week 41 mapped with universities
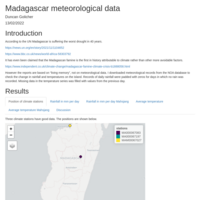
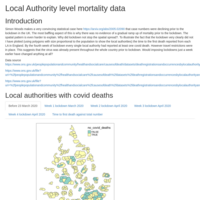
COVID-19 cases (number of people with a lab-confirmed positive test result) in England by Middle Super Output Area (MSOA). MSOAs are small areas with around 7,200 average population. The data are updated each weekday, and show the latest 7 days for which near-complete data are available.
University campus sites added to the map

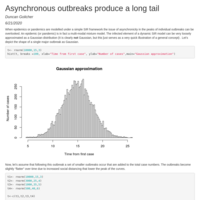
Excess death analysis starter
Some ideas regarding how to extract excess deaths using mixed effects generalized additive modelling to pool countries.
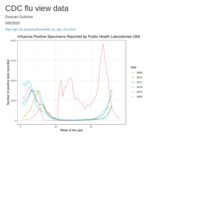
CDC flu view summary
Plot of total laboratory recorded positive tests for all flu strains in the USA. Data from https://gis.cdc.gov/grasp/fluview/flu_by_age_virus.html
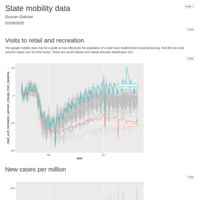
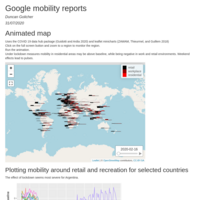
Google mobility for US states
A quick visualisation of Google mobility data for visits to retail and recreation in the USA
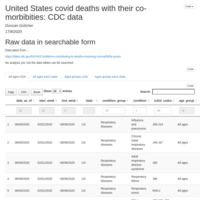
Searchable CDC mortality data
A quick reformat of CDC data for easy searching. No analysis and figures at present.
https://data.cdc.gov/NCHS/Conditions-contributing-to-deaths-involving-corona/hk9y-quqm
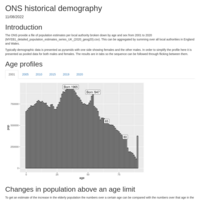
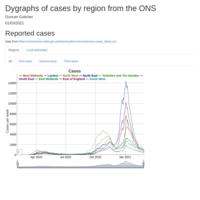
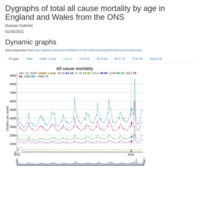
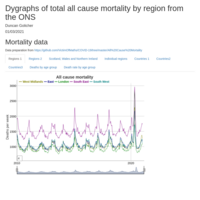
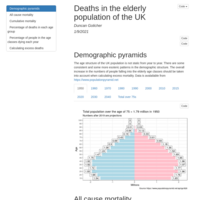
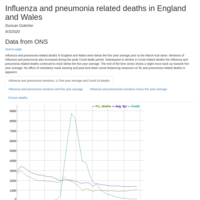
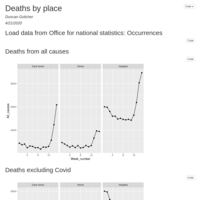
ONS
A really great data visualisation from UK Office for national statistics
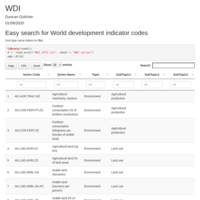
World development indicators
Easy search to find codes

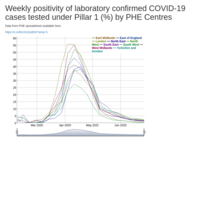
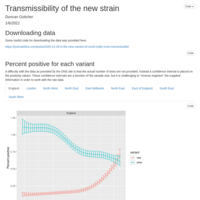
Percent positive Covid tests per region
Data from public health Englsnd
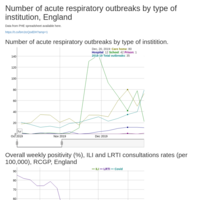
Outbreaks of acute respiratory illness in Egland
Data from last page of spreadsheet https://t.co/bm1tcQodDH?amp=1

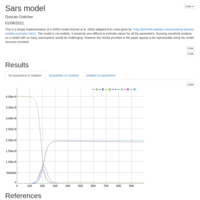
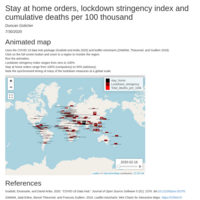
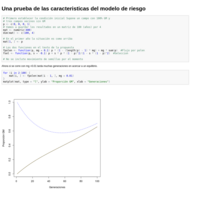
Heuristic modelling of Covid
Heuristic modelling of the Covid pandemic using data from Johns Hokins and SIR models

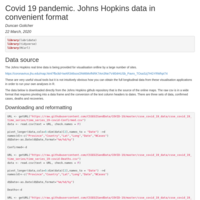
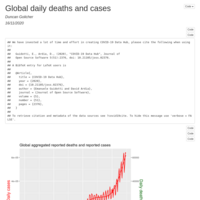
John Hopkins Covid-19 data in convenient format
R code to download and format the John Hopkins covid data for analysis in R or other software. Data are aggregated to country and joined to form a single searchable data frame.


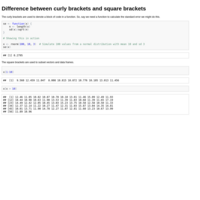
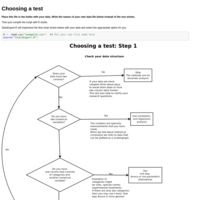
Simple tests crib sheet
Quick access to code for simple statistical tests

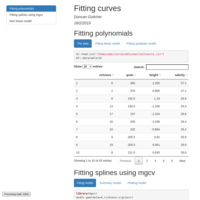
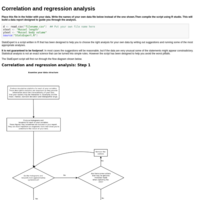
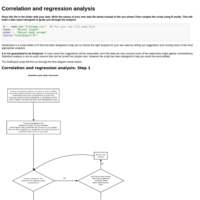
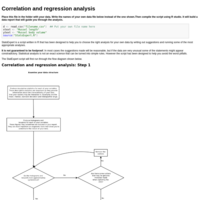
Regresion and anova crib sheet
Quick code access for fitting simple linear models
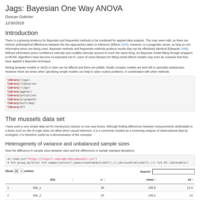
Bayesian one way analysis of variance
Simple example of pooled and unpooled variance models of ANOVA using JAGS

Simple example of Bayesian inference
A very simple example.

Quick editing of maps
More detail needed. Quick crib sheet on editing maps
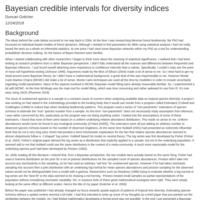
Bayesian credible intervals for diversity indices
Using Jags to calculate credible intervals for species diversity indices.
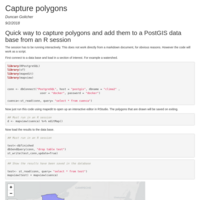
Mapedit polygon capture
Quick polygon capture from R
Simple tables
Need to work on presentation
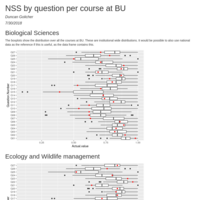
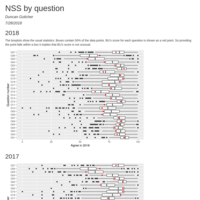
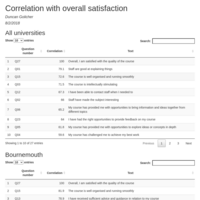
NSS questions benchmarking for BU
Boxplots and raw data tables of NSS scores per question for all UK institutions.
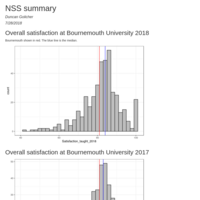
Overall NSS scores 2018
Histograms for Bournemouth and searchable data table
Loading into monkswood data base
Some potentially useful examples of the use of sf on my server
Chris_test
Testing
Chris_test
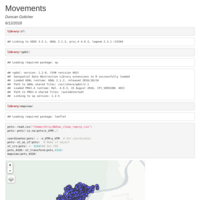
Starting off getting the movement data into R


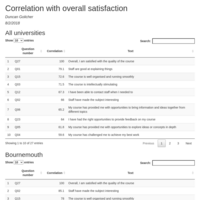
Analysing Likert scale satisfaction scores
Investigating methods for analysing satisfaction scores
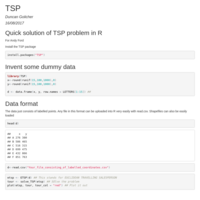
Quick solution to Euclidean TSP problem
For Andy Ford
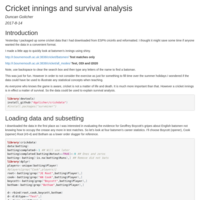
Cricket innings and survival analysis
Analysing batsmen't innings using survival analysis.

Changes in the probability of drawn matches
Further analysis of test match scores, inspired by Geoffrey Boycott
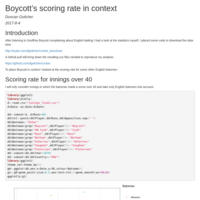
Boycott in context
Boycotts's scoring rate placed in the context of the modern game
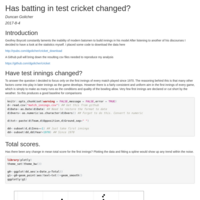
Has batting in test cricket changed?
First innings totals and scoring rates analysed using splines and linear mixed effects.
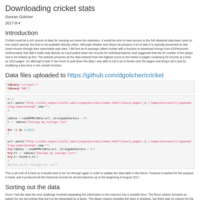
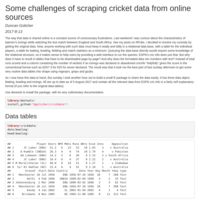
Downloading cricket statistics
Pull down and compile data on all batsmen's innings up to August 2017

Regression plus
Shiny app


Document
Starting MoRph

Publish Document
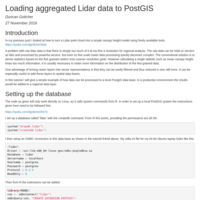
Aggregating a canopy height model to a PostGIS vector graticule.
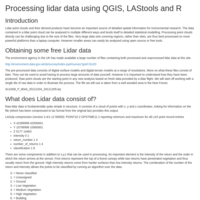
Lidar processsing using QGIS, LAStools and R
Simple processing of lidar point clouds and data extraction to polygons using R.


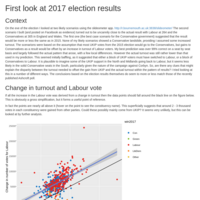
elections
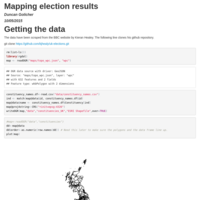
Reformatting the data scraped from the BBC election results site by http://kieranhealy.org/

qecol_test
Testing simple package buidling in RStudio
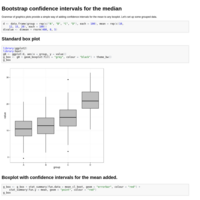
Adding bootstrap confidence intervals for the median to boxplots
Adding bootstrap confidence intervals for the median to boxplots
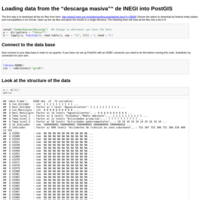
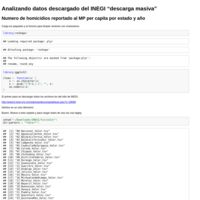
Loading data from the “descarga masiva”“ de INEGI into PostGIS
Moving data to PostGIS

Working with PostGIS from R
Example analysis for Geostats course,Quebec.

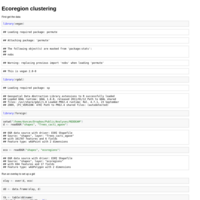
Ecoregion clustering
Quick test of concept.

Analysis of metal ion concentrations
Student data

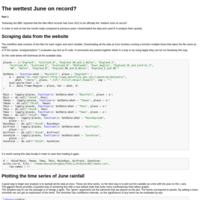
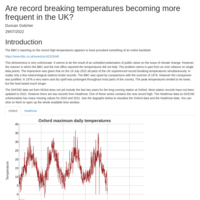
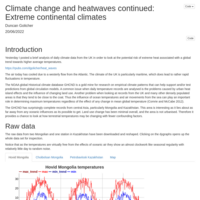
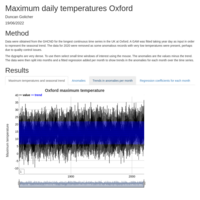
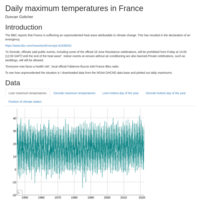
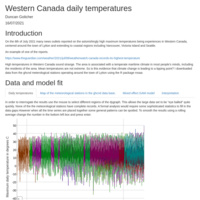
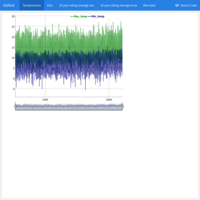
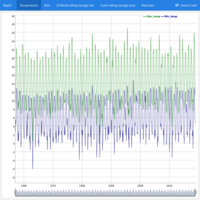
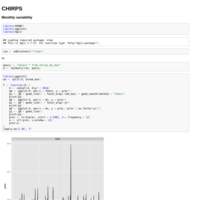
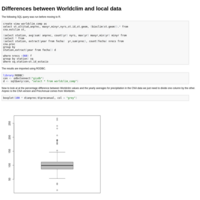
The wettest June on record?
Analysing some climate records from the UK met office.