
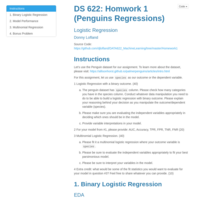
djlofland
Donny Lofland
Recently Published

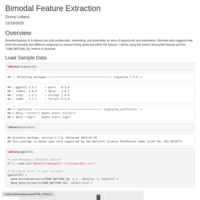
Bimodal Feature Extraction
Bimodal features in a dataset are both problematic, interesting, and potentially an area of opportunity and exploration. Bimodal data suggests that there are possibly two different subgroups or classes being observed within the feature. I will be using the classic Moneyball dataset and the TEAM_BATTING_SO feature to illustrate.
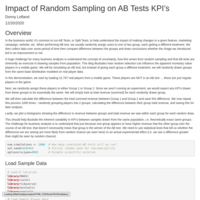
Impact of Random Sampling on AB Tests KPI’s
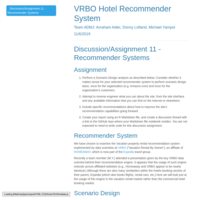
In the business world, it’s common to run AB Tests, or Split Tests, to help understand the impact of making changes to a given feature, marketing campaign, website, etc. When performing AB test, we usually randomly assign users to one of two group, each getting a different treatment. We then collect data over some period of time then compare difference between the groups and draw conclusions whether the chage we introduced led to an improvement or not.
A huge challenge for many business analysts is understand the concept of uncertainty, how this arises from random sampling and that AB tests are inherently an exercise in drawing samples from population. This blog illustrates how random selection can influence the apparent monetary value players in a mobile game. We will be simulating an AB test, but instead of giving each group a different treatment, we will randomly drawn groups from the same base distribution modeled on real player data.
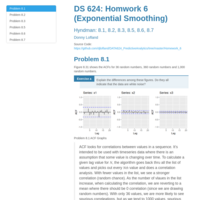
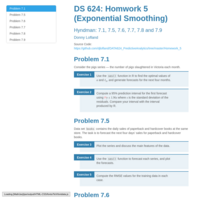
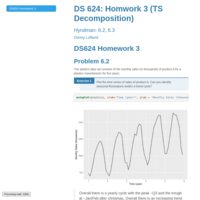
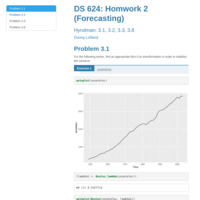
DATA 624 - Homework 5 (Exponential Smoothing)
Hyndman Chapter 7 problems
DATA 621 - Assignment 3 - Crime Logistic Regression
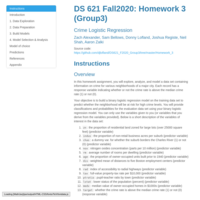
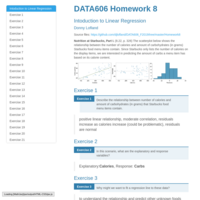
In this homework assignment, you will explore, analyze and model a data set containing information on crime for various neighborhoods of a major city. Each record has a response variable indicating whether or not the crime rate is above the median crime rate (1) or not (0).
Your objective is to build a binary logistic regression model on the training data set to predict whether the neighborhood will be at risk for high crime levels. You will provide classifications and probabilities for the evaluation data set using your binary logistic regression model. You can only use the variables given to you (or variables that you derive from the variables provided).
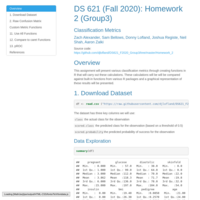
DATA 621 - Assignment 2 - Cllassification Metrics
This assignment will present various classification metrics through creating functions in R that will carry out these calculations. These calculations will be will be compared against built-in functions from various R packages and a graphical representation of these results will be presented.
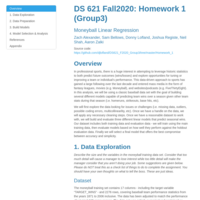
Data 621 - Assignment 1 - Moneyball
In professional sports, there is a huge interest in attempting to leverage historic statistics to both predict future outcomes (wins/losses) and explore opportunities for tuning or improving a team or individual’s performance. This data-driven approach to sports has gained a large following over the last decade and entered mass media in the form of fantasy leagues, movies (e.g. Moneyball), and websites/podcasts (e.g. FiveThirtyEight). In this analysis, we will be using a classic baseball data set with the goal to build several different models capable of predicting team wins over a season given on other team stats during that season (i.e. homeruns, strikeouts, base hits, etc).
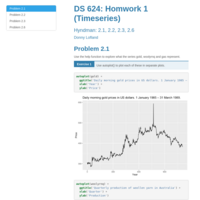
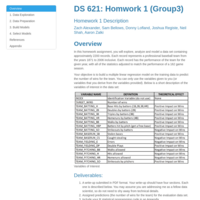
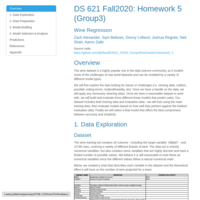
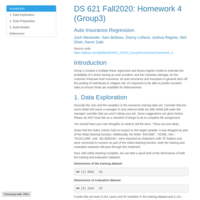
DS621 Homework 1 (Group3)
In this homework assignment, you will explore, analyze and model a data set containing approximately 2200
records. Each record represents a professional baseball team from the years 1871 to 2006 inclusive. Each record
has the performance of the team for the given year, with all of the statistics adjusted to match the performance of
a 162 game season.
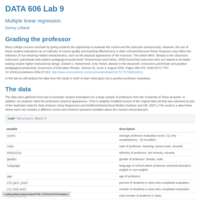
Your objective is to build a multiple linear regression model on the training data to predict the number of wins
for the team. You can only use the variables given to you (or variables that you derive from the variables
provided).
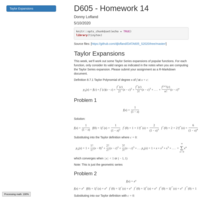
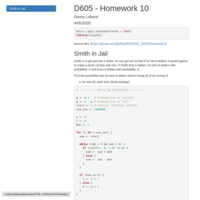
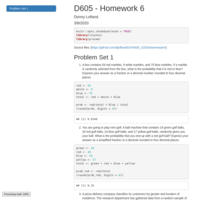
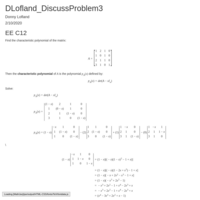
DATA605 Homework 14
Taylor Series
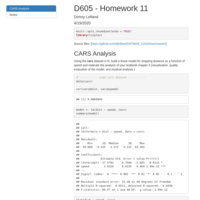
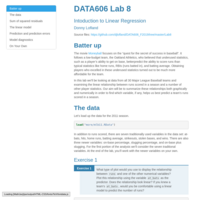
DATA605 Homework 11
Simple Linear REgression on cars dataset
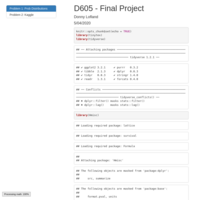
DATA606 - Final Project
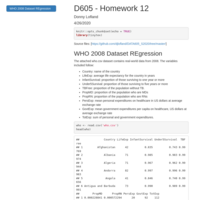
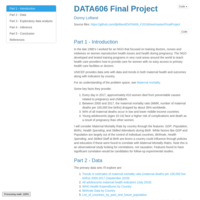
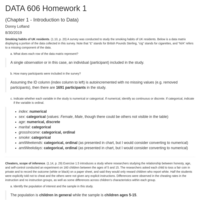
Explore Maternal Mortality Rate (MMR) by country through the features: GDP, Population, Births, Health Spending, and Skilled Attendants during Birth. While factors like GDP and Population are largely out of the control of individual countries, Birthrate, Health Spending, and Trained Staff at Birth are levers a country could influence through policies and education if these were found to correlate with Maternal Mortality Rates.

Most Valued Data Science Skills
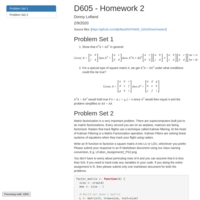
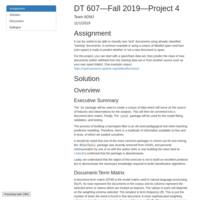
DT 607—Fall 2019—Project 3
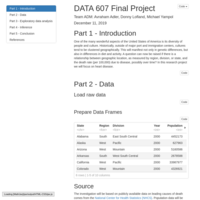
Donny Lofland, Michael Yampol, Alain Kuiete Tchoupou, Avraham Adler
10/20/2019
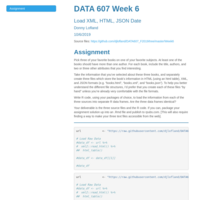

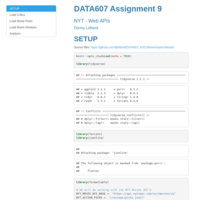
Data607- Week 6 (Load XML, HTML, JSON Data)
Pick three of your favorite books on one of your favorite subjects. At least one of the books should have more than one author. For each book, include the title, authors, and two or three other attributes that you find interesting.
Take the information that you’ve selected about these three books, and separately create three files which store the book’s information in HTML (using an html table), XML, and JSON formats (e.g. “books.html”, “books.xml”, and “books.json”). To help you better understand the different file structures, I’d prefer that you create each of these files “by hand” unless you’re already very comfortable with the file formats.
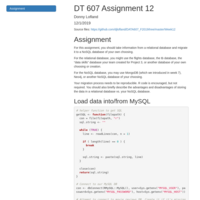
Write R code, using your packages of choice, to load the information from each of the three sources into separate R data frames. Are the three data frames identical?
Your deliverable is the three source files and the R code. If you can, package your assignment solution up into an .Rmd file and publish to rpubs.com. [This will also require finding a way to make your three text files accessible from the web].
Data607- Project 2
A brief analysis of worldwide Materal Mortality Rates (MMR) from 2000-2015.
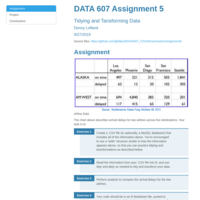
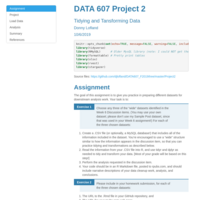
DATA607- Homework 5 (Tidy & Transform Data)
The chart above describes arrival delays for two airlines across five destinations. Your task is to:
1. Create a .CSV file (or optionally, a MySQL database!) that includes all of the information above.
You’re encouraged to use a “wide” structure similar to how the information appears above, so
that you can practice tidying and transformations as described below.
2. Read the information from your .CSV file into R, and use tidyr and dplyr as needed to tidy
and transform your data.
3. Perform analysis to compare the arrival delays for the two airlines.
4. Your code should be in an R Markdown file, posted to rpubs.com, and should include narrative
descriptions of your data cleanup work, analysis, and conclusions. Please include in your
homework submission: **The URL to the .Rmd file in your GitHub repository** and the **URL for your rpubs.com web page**.
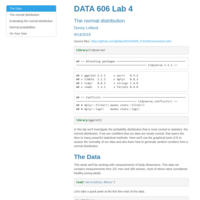
DATA606- Lab 4 (The Normal Distribution)
In this lab, we’ll investigate the probability distribution that is most central to statistics: the normal distribution. If we are confident that our data are nearly normal, that opens the door to many powerful statistical methods. Here we’ll use the graphical tools of R to assess the normality of our data and also learn how to generate random numbers from a normal distribution.
DATA606- Homework 4
Chapter 4 Homework over Distributions of random variables
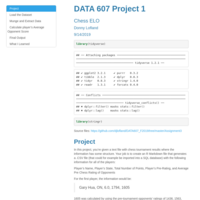
DATA607- Project 1
In this project, you’re given a text file with chess tournament results where the information has some structure. Your job is to create an R Markdown file that generates a .CSV file (that could for example be imported into a SQL database) with the following information for all of the players:
Player’s Name, Player’s State, Total Number of Points, Player’s Pre-Rating, and Average Pre Chess Rating of Opponents
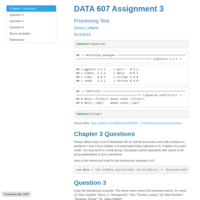
DATA607- Homework 3
Please deliver links to an R Markdown file (in GitHub and rpubs.com) with solutions to problems 3 and 4 from chapter 8 of Automated Data Collection in R. Problem 9 is extra credit. You may work in a small group, but please submit separately with names of all group participants in your submission.
Here is the referenced code for the introductory example in #3:
raw.data <-"555-1239Moe Szyslak(636) 555-0113Burns, C. Montgomery555-6542Rev. Timothy Lovejoy555 8904Ned Flanders636-555-3226Simpson, Homer5553642Dr. Julius Hibbert"
Due end of day Sunday.
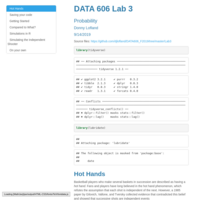
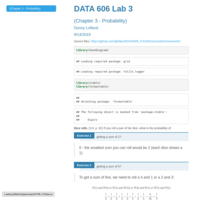
DATA606- Lab 2 (Probabilities)
Week 3 lab over probabilities
DATA606- Homework 3
Probability homework from chapter 3
DATA607- Homework 2
Choose six recent popular movies. Ask at least five people that you know (friends, family, classmates, imaginary friends) to rate each of these movie that they have seen on a scale of 1 to 5. Take the results (observations) and store them in a SQL database. Load the information into an R dataframe. Your deliverables should include your SQL scripts and your R Markdown code, posted to GitHub. This is by design a very open ended assignment. A variety of reasonable approaches are acceptable. You can (and should) blank out your SQL password if your solution requires it; otherwise, full credit requires that your code is “reproducible,” with the assumption that I have the same database server and R software.
DATA606- Presentation
You are responsible for presenting one practice homework problem during the semester. Please sign up as-soon-as possible as there are limited slots per week. Try to keep each presentation to five minutes or less. Sign-up on this Google Spreadsheet:
DATA606- Homework 2
Homework over chapter 2
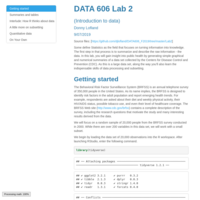
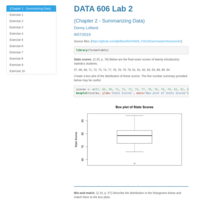
DATA606- Lab 2 (Introduction to data)
Some define Statistics as the field that focuses on turning information into
knowledge. The first step in that process is to summarize and describe the raw
information - the data. In this lab, you will gain insight into public health
by generating simple graphical and numerical summaries of a data set collected
by the Centers for Disease Control and Prevention (CDC). As this is a large
data set, along the way you'll also learn the indispensable skills of data
processing and subsetting.
DATA607- Homework 1
Instructions: Your task is to study the dataset and the associated description of the data (i.e. “data dictionary”). You may need to look around a bit, but it’s there! You should take the data, and create a data frame with a subset of the columns in the dataset. You should include the column that indicates edible or poisonous and three or four other columns. You should also add meaningful column names and replace the abbreviations used in the data—for example, in the appropriate column, “e” might become “edible.” Your deliverable is the R code to perform these transformation tasks.
Data: Mushrooms Dataset. A famous—if slightly moldy— dataset about mushrooms can be found in the UCI repository here: https://archive.ics.uci.edu/ml/datasets/Mushroom.
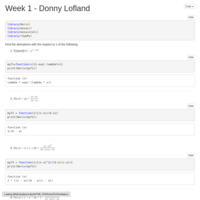
R Workshop - Assignment 1
Answer the questions