
eam
Eamonn O'Brien
Recently Published

Quarto Report Example
First quarto example

Nested Variance Components CLSI EP5 Stan
... to return to...

Nested Variance Components Analysis (Bayesian)
Nested Variance Components Analysis (Bayesian)

Bayesian STAN and frequentist variance components
...in progress...

F Distribution: An investigation on the ratio of variances from normally distributed populations
F Distribution: An investigation on the ratio of variances from normally distributed populations

F Distribution: An investigation on the ratio of variances (in brief)
F Distribution: An investigation on the ratio of variances (in brief)

‘Cutpoints made up by boys in back rooms’
‘Cutpoints made up by boys in back rooms’: Dichotomisation is a disaster!

When the sample size is two, a 50% confidence interval is defined by the two values
When the sample size is two, a 50% confidence interval is defined by the two values

Paired t-test and one sample t-test power equivalence (also two sample t-test power is shown)
Power analysis for a paired-sample t-test is the same as for the one-sample t-test. This is due to the fact that in the paired-sample t-test we compute the difference in the two scores for each subject and then compute the mean and standard deviation of the differences. This turns the paired-sample t-test into a one-sample t-test.

Bayesian Predictive Power for Paired T-test using STAN
Pilot data has been used to estimate the standard deviation of the differences for a future paired study. The pilot data is only 10 paired samples. A single point estimate of power does not reflect the uncertainty of the quantities used to calculate the power. A Bayesian approach using STAN is used to generate the predictive power distribution which will give a comprehensive illustration of what it is reasonable to believe about the power of the planned future study. The Bayesian predictive power distribution completely summarizes what is known about the power, based on the historical data available.

Pierre Rémond de Montmort's matching problem 1708
In its simplest form the problem of coincidences (matches, recontres) may be formulated as follows: Let there be n objects numbered from 1 to n, and let them be ordered at random, assuming that the n! permutations are equally probable. A coincidence occurs if object number i is found at the ith place. The problem is to find the number of permutations with at least one coincidence or, equivalently, the probability of at least one coincidence.
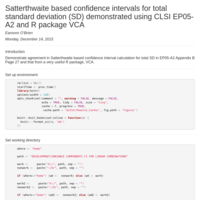
Satterthwaite based confidence intervals for total standard deviation (SD) demonstrated using CLSI EP05-A2 and R package VCA
Demonstrate agreement in Satterthwaite based confidence interval calculation for total SD in EP05-A2 Appendix B Page 27 and that from a very useful R package, VCA.

Measures of accuracy, binary diagnostic tests
Basic measures of diagnostic accuracy are calculated and presented using frequentist and Bayesian approaches


Coin tossing simulation
1) What's the probability of x consecutive results with a limited number of tosses?
2) On average how many tosses to observe x consecutive results in a row?