Sign In
Username or Email
Password
Forgot your password?
R
Pubs
by RStudio
Sign in
Register
esuess
Eric A. Suess
Recently Published
Stat 451 Project Dashboard
6 months ago
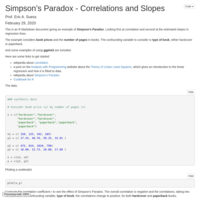
Simpson's Paradox Flexdashboard
over 1 year ago
waymet
over 1 year ago
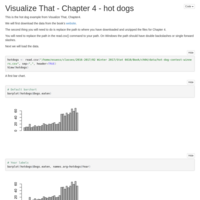
Hotdog Winners
over 1 year ago
kNN Example2
over 2 years ago
kNN Example
over 2 years ago
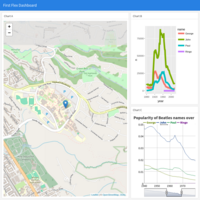
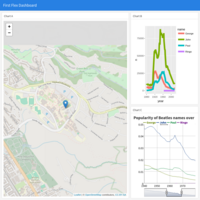
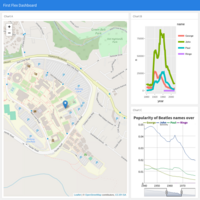
First FlexDashboard
over 2 years ago
Interactive Examples3
over 2 years ago
Palmer Penguines 2
over 2 years ago
first flexdashboard new
over 2 years ago
Interactive Examples3
over 2 years ago
Interactive Examples2
over 2 years ago
Interactive Examples
over 2 years ago
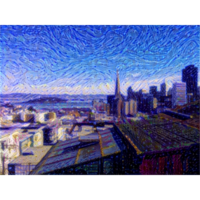
SFVG
about 3 years ago
Palmer Penguins Flexdashboard
over 3 years ago
first_flexdashboard_2022
over 3 years ago
Welcome01
over 3 years ago
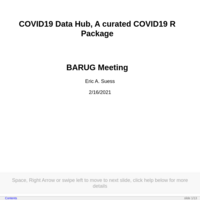
COVID19-Hub_BARUG_Presentation_2021
over 5 years ago
My first flexdashboard
over 5 years ago
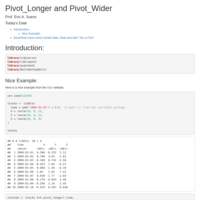
Stocks_Pivot_Longer
over 5 years ago
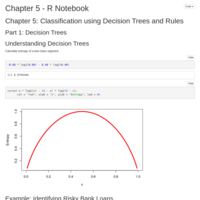
Chap05
about 6 years ago
Time Series
over 7 years ago
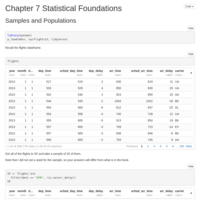
Chapter 7 Statistical Foundations
over 7 years ago
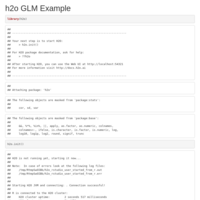
h2o GLM Example
over 7 years ago
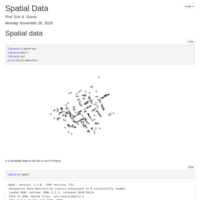
Spatial Data
over 7 years ago
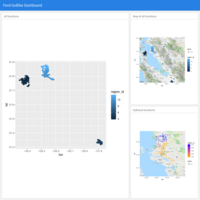
Ford GoBike Dashboard
over 7 years ago
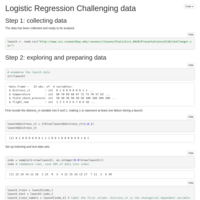
Logistic Regression Challenging data
over 7 years ago
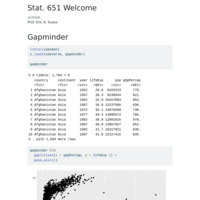
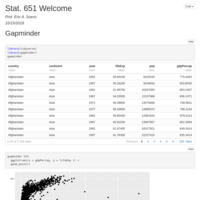
Stat. 651 Welcome
over 7 years ago
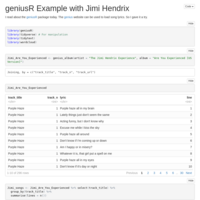
geniusR Example with Jimi Hendrix
almost 8 years ago
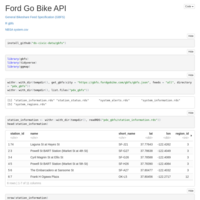
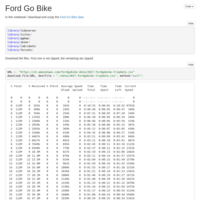
Ford Go Bike Version02 GBFS API
almost 8 years ago
Ford Go Bike Version01
almost 8 years ago
Chapter06
about 8 years ago
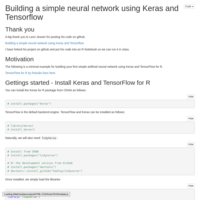
uilding a simple neural network using Keras and Tensorflow
about 8 years ago
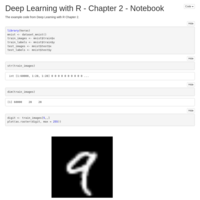
Deep Learning with R Chapter 2
about 8 years ago
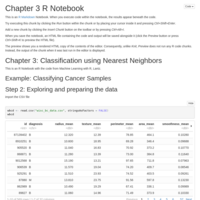
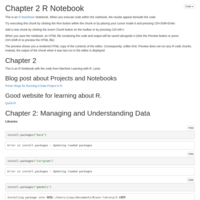
Chapter 3 R Notebook
about 8 years ago
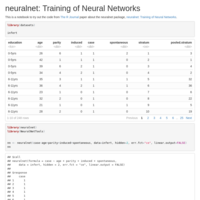
neuralnet: Training of Neural Networks
about 8 years ago
MLwR Chapter 2 Notebook
about 8 years ago
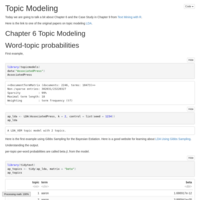
Topic Modeling
about 8 years ago
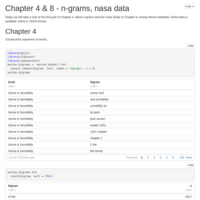
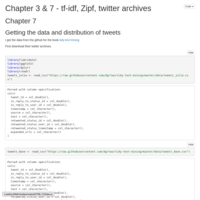
Chapter 4 & 8 - n-grams, nasa data
over 8 years ago
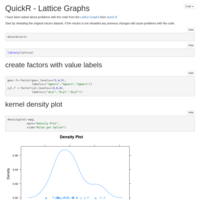
QuickR - Lattice Graphs
over 8 years ago
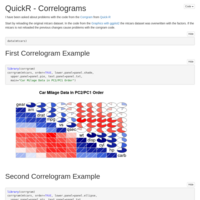
QuickR - Correlograms
over 8 years ago
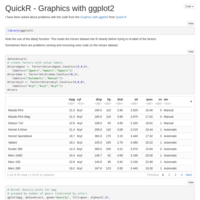
QuickR - Graphics with ggplot2
over 8 years ago
tidytext02
over 8 years ago
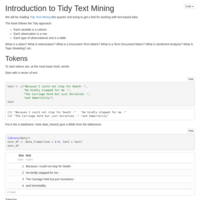
Introduction to Text Mining
Code from the book Text Mining with R, A Tidy Approach by Silge and Robinson
over 8 years ago
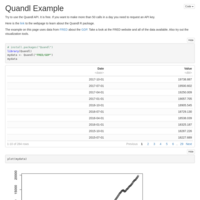
Quandl Example
over 8 years ago
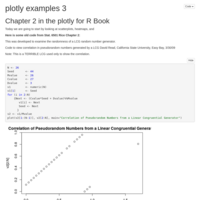
Plotly Examples 3
over 8 years ago
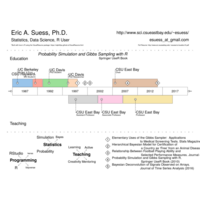
EricASuess-VisualResume
over 8 years ago
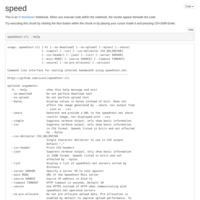
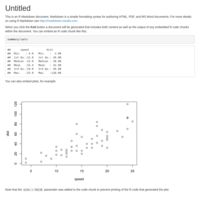
Speed
over 8 years ago
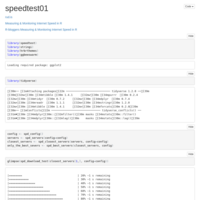
Speedtest01
over 8 years ago
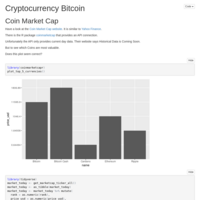
Bitcoin01
over 8 years ago
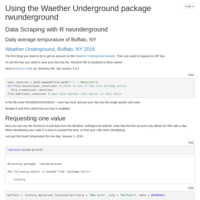
Buffalo01_API
over 8 years ago
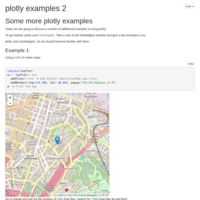
plotly examples 2
over 8 years ago
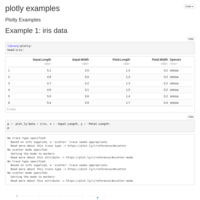
Plotly Examples
over 8 years ago
RBVNsim5
over 8 years ago
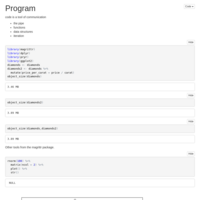
Program
over 8 years ago
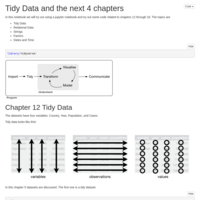
TidyData
over 8 years ago
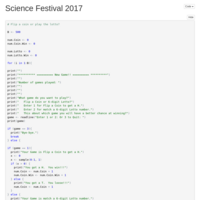
Science Festival 2017 - Flip a Coin or Lotto
over 8 years ago
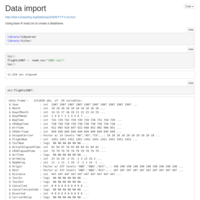
Import
over 8 years ago
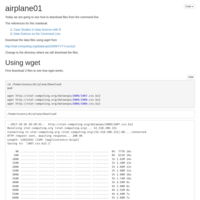
airline01
over 8 years ago
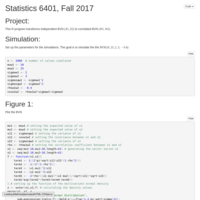
Project
over 8 years ago
diamondsEDA
over 8 years ago
Test Document
over 8 years ago
Chapter 5 - R for Data Science
over 8 years ago
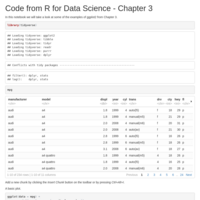
Chapter3-ggplot2
over 8 years ago
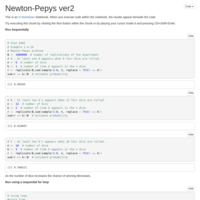
Newton-Pepys_ver2
over 8 years ago
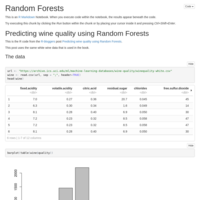
Random Forest
about 9 years ago
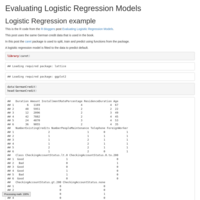
Logistic Regression
about 9 years ago
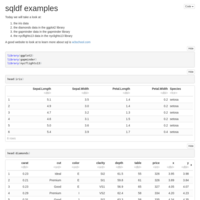
sqldf examples
about 9 years ago
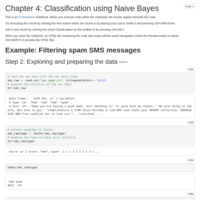
Naive Bayes
about 9 years ago
IntroR
about 9 years ago
Language of Statistics
about 9 years ago
wordcloud02
about 9 years ago
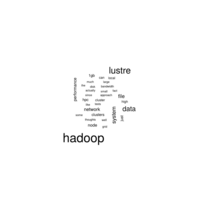
BigData101-wordcloud01
about 9 years ago
Proportions2
over 9 years ago
Proportions
over 9 years ago
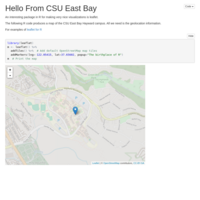
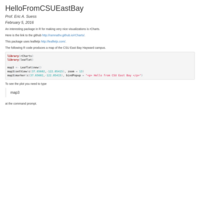
Hello From CSU East Bay
over 9 years ago
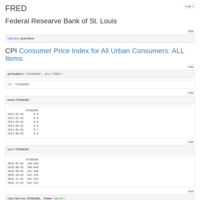
FRED
over 9 years ago
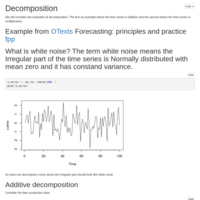
decomposition
over 9 years ago
unemployment
over 9 years ago
postage
over 9 years ago
worldpopulation
over 9 years ago
subscribers
over 9 years ago
hotdogs
over 9 years ago
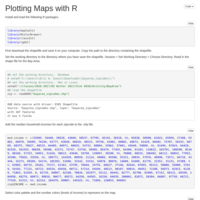
PlottingMapsWithR
over 9 years ago
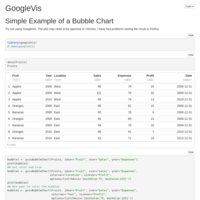
GoogleVis
over 9 years ago
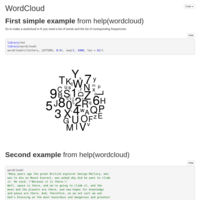
WordCloud
over 9 years ago
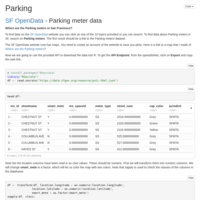
parking
over 9 years ago
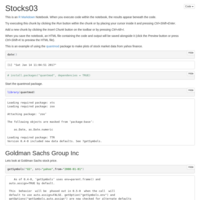
stocks03
over 9 years ago
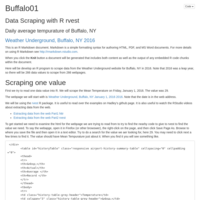
Buffalo01
over 9 years ago
Spatial
about 10 years ago
Clustering
about 10 years ago
Heatmaps
about 10 years ago
Correlation3
about 10 years ago
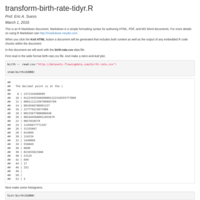
birth-rate
about 10 years ago
Correlation2
about 10 years ago
Correlation
about 10 years ago
SimpsonsParadox
about 10 years ago
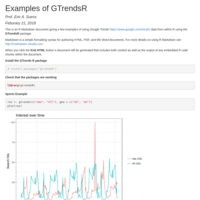
GTrendsR
about 10 years ago
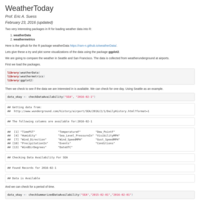
WeatherToday
about 10 years ago
HelloFromCSUEastBay
over 10 years ago
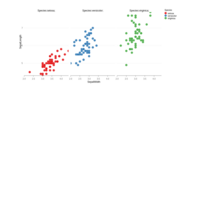
Scatterplot_iris
over 10 years ago
TimeSeries2
over 10 years ago
TimeSeries
over 10 years ago
Tools2
over 10 years ago
Tools
over 10 years ago
DataTypes
over 10 years ago
DataScraping
over 10 years ago
GettingStarted
over 10 years ago
Welcome
over 10 years ago
Classroom Demonstration: Data Visualization in Introductory Statistics classes, bubble charts and maps
JSM 2015 Seattle
almost 11 years ago
Classroom Demonstration: Data Visualization in Introductory Statistics classes, bubble charts and maps
JSM 2015 Seattle
almost 11 years ago
first
almost 11 years ago
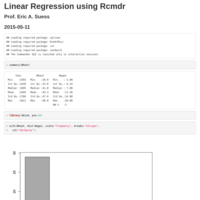
LinearRegressionRCommanderMarkdown
about 11 years ago
Classroom Demonstrations of Big Data
Prof. Eric A. Suess CSU East Bay JSM 2014 Boston
almost 12 years ago