
joewarner89
Warner Alexis
Recently Published


Data 608 Story 7
Hide Assignment Information
Instructions
The US Geological Survey publishes a list of Strategic Minerals ( https://www.usgs.gov/news/national-news-release/us-geological-survey-releases-2022-list-critical-minerals ). Having a secure supply of these minerals is essential to our security and economic prosperity. However many of these minerals are sourced from outside of the US. This assignment is to develop a reference catalog of the source or sources of each of these minerals and a judgment on the reliability of each source under stressed circumstance (e.g. war, economic crisis, etc.)


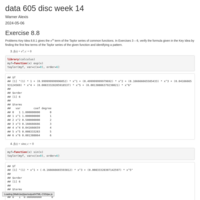


DATA 605 - ASSIGNMENT 12
Using the “cars” dataset in R, build a linear model for stopping distance as a function of speed and
replicate the analysis of your textbook chapter 3 (visualization, quality evaluation of the model, and
residual analysis.)


DATA 605 disc Week 7
For which of the following random variables would it be appropriate to assign a uniform distribution? (a) Let X represent the roll of one die.
Let X represent the number of heads obtained in three tosses of a coin.
A roulette wheel has 38 possible outcomes: 0, 00, and 1 through 36. Let X represent the outcome when a roulette wheel is spun.
Let X represent the birthday of a randomly chosen person.
Let X represent the number


Data 605 Assignment 6 Discussion
Four people are to be arranged in a row to have their picture taken. In how
many ways can this be done?

DATA 605 - ASSIGNMENT 5
Answer Probability Problems


DATA 605 - ASSIGNMENT 3
What is the rank of the matrix A?
A =
1 2 3 4
−1 0 1 3
0 1 −2 1
5 4 −2 −3
(1)
(2) Given an mxn matrix where m > n, what can be the maximum rank? The minimum rank, assuming that the matrix is non-zero?
(3) What is the rank of matrix B?
B =
1 2 1
3 6 3
2 4 2
(2)
2. Problem set 2
Compute the eigenvalues and eigenvectors of the matrix A. You’ll need to show your
work. You’ll need to write out the characteristic polynomial and show your solution.
A =
1 2 3
0 4 5
0 0 6
(3)
Please show your work using an R-markdown document. Please name your assignment
submission with your first initial and last name.

DATA 605 - Exercise C5
Working within the vector space C3, determine if matrix b =[4 3 1] is in the subspace of matrix W = {[3 2 3],[1 0 3],[1 1 0],[2 1 3]} . Give me steps by steps calculations

DATA 605 - ASSIGNMENT 2
1. Problem set 1
(1) Show that AT A 6= AAT
in general. (Proof and demonstration.)
(2) For a special type of square matrix A, we get AT A = AAT
. Under what conditions
could this be true? (Hint: The Identity matrix I is an example of such a matrix).
Please typeset your response using LaTeX mode in RStudio. If you do it in paper, please
either scan or take a picture of the work and submit it. Please ensure that your image is
legible and that your submissions are named using your first initial, last name, assignment
and problem set within the assignment. E.g. LFulton_Assignment2_PS1.png
2. Problem set 2
Matrix factorization is a very important problem. There are supercomputers built just
to do matrix factorizations. Every second you are on an airplane, matrices are being
factorized. Radars that track flights use a technique called Kalman filtering. At the heart
of Kalman Filtering is a Matrix Factorization operation. Kalman Filters are solving linear
systems of equations when they track your flight using radars.
Write an R function to factorize a square matrix A into LU or LDU, whichever you
prefer. Please submit your response in an R Markdown document using our class naming
convention, E.g. LFulton_Assignment2_PS2.png
You don’t have to worry about permuting rows of A and you can assume that A is less
than 5x5, if you need to hard-code any variables in your code. If you doing the entire
assignment in R, then please submit only one markdown document for both the problems.

Data 607 - Final Project - Hospital Readmission Reduction
The center for Medicare and Medicaid Services begun to reduce payment to Hospitals for excessive readmissions on October 1rst 2012 as part of the Affordable Care Act. Hospitals’ mission switches strategies to reduce rehospitalization rate and improves quality care so patients don’t come back within 30 days readmission. There are several strategies implemented to enable the process but, the use of data analytics has been indispensable to reduction of readmission rate. Warchol et al. said: “Data analytics can be used to improve clinical operations, watch for care patterns, and identify readmission risk.” He acknowledges that other researcher like Monga suggested that hospitals can design an analytical model to predict the likelihood of patients’ readmission based on information collected in Electronic Health Records (EHR). The purpose of this project is to predict the hospital readmission from this data set in UC Irvine Machine Learning Repository called “Diabetes 130-US hospitals for years 1999-2008”.

DATA 607 - Tidyverse Extended Assignment
In this assignment, you’ll practice collaborating around a code project with GitHub. You could consider our collective work as building out a book of examples on how to use TidyVerse functions.
GitHub repository: https://github.com/acatlin/FALL2023TIDYVERSE
FiveThirtyEight.com datasets.
Kaggle datasets.
Your task here is to Extend an Existing Example. Using one of your classmate’s examples (as created above), extend his or her example with additional annotated code. (15 points)
You should clone the provided repository. Once you have code to submit, you should make a pull request on the shared repository. You should also update the README.md file with your example.
After you’ve extended your classmate's vignette, please submit your GitHub handle name in the submission link provided below. This will let your instructor know that your work is ready to be peer-graded.
You should complete your submission on the schedule stated in the course syllabus.


DATA 607 - Document Classification
It can be useful to be able to classify new "test" documents using already classified "training" documents. A common example is using a corpus of labeled spam and ham (non-spam) e-mails to predict whether or not a new document is spam.
For this project, you can start with a spam/ham dataset, then predict the class of new documents (either withheld from the training dataset or from another source such as your own spam folder). One example corpus: https://spamassassin.apache.org/old/publiccorpus/
Here are two short videos that you may find helpful.
The first video shows how to unzip the provided files.

DATA 607 - Sentiment Analysis
n Text Mining with R, Chapter 2 looks at Sentiment Analysis. In this assignment, you should start by getting the primary example code from chapter 2 working in an R Markdown document. You should provide a citation to this base code. You’re then asked to extend the code in two ways:
Work with a different corpus of your choosing, and
Incorporate at least one additional sentiment lexicon (possibly from another R package that you’ve found through research).
As usual, please submit links to both an .Rmd file posted in your GitHub repository and to your code on rpubs.com. You make work on a small team on this assignment.


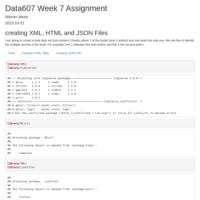
DATA 607 - Week Assignment 7
Creating XLM HTML and JSON Files


DATA 607 - Week 5 assignment
The chart above describes arrival delays for two airlines across five destinations. Your task is to:
(1) Create a .CSV file (or optionally, a MySQL database!) that includes all of the information above.
You’re encouraged to use a “wide” structure similar to how the information appears above, so
that you can practice tidying and transformations as described below.
(2) Read the information from your .CSV file into R, and use tidyr and dplyr as needed to tidy
and transform your data.
(3) Perform analysis to compare the arrival delays for the two airlines.
(4) Your code should be in an R Markdown file, posted to rpubs.com, and should include narrative
descriptions of your data cleanup work, analysis, and conclusions. Please include in your
homework submission:
The URL to the .Rmd file in your GitHub repository. and
The URL for your rpubs.com web page.

Data 607 - Data Analysis
n this project, you’re given a text file with chess tournament results where the information has some structure. Your
job is to create an R Markdown file that generates a .CSV file (that could for example be imported into a SQL database)
with the following information for all of the players:
Player’s Name, Player’s State, Total Number of Points, Player’s Pre-Rating, and Average Pre Chess Rating of Opponents
For the first player, the information would be:
Gary Hua, ON, 6.0, 1794, 1605
1605 was calculated by using the pre-tournament opponents’ ratings of 1436, 1563, 1600, 1610, 1649, 1663, 1716, and
dividing by the total number of games played.
If you have questions about the meaning of the data or the results, please post them on the discussion forum. Data
science, like chess, is a game of back and forth…
The chess rating system (invented by a Minnesota statistician named Arpad Elo) has been used in many other contexts,
including assessing relative strength of employment candidates by human resource departments.


Assignment 1 – Loading Data into a Data Frame
You should first study the data and any other information on the GitHub site, and read the associated
fivethirtyeight.com article.
To receive full credit, you should:
1. Take the data, and create one or more code blocks. You should finish with a data frame that contains a
subset of the columns in your selected dataset. If there is an obvious target (aka predictor or independent)
variable, you should include this in your set of columns. You should include (or add if necessary)
meaningful column names and replace (if necessary) any non-intuitive abbreviations used in the data that
you selected. For example, if you had instead been tasked with working with the UCI mushroom dataset,
you would include the target column for edible or poisonous, and transform “e” values to “edible.” Your
deliverable is the R code to perform these transformation tasks.
2. Make sure that the original data file is accessible through your code—for example, stored in a GitHub
repository or AWS S3 bucket and referenced in your code. If the code references data on your local
machine, then your work is not reproducible!
3. Start your R Markdown or Quarto document with a two to three sentence “Overview” or “Introduction”
description of what the article that you chose is about, and include a link to the article.
4. Finish with a “Conclusions” or “Findings and Recommendations” text block that includes what you might do
to extend, verify, or update the work from the selected article.

DATA 606 - Intro to Lab 1
The goal of this lab is to introduce you to R and RStudio, which you’ll be using throughout the course both to learn the statistical concepts discussed in the course and to analyze real data and come to informed conclusions.

R Bridge Course Final Project
This is a final project to show off what you have learned. Select your data set from the list below: http://vincentarelbundock.github.io/Rdatasets/ (click on the csv index for a list). Another good source is found here:
https://https://archive.ics.uci.edu/ml/datasets.html
Start with a problem statement at the beginning and make sure to answer it at the end with what you learned
The presentation approach is up to you but it should contain the following:
1. Data Exploration: This should include summary statistics, means, medians, quartiles, or any other relevant information about the data set. Please include some conclusions in the R Markdown text.
2. Data wrangling: Please perform some basic transformations. They will need to make sense but could include column renaming, creating a subset of the data, replacing values, or creating new columns with derived data (for example – if it makes sense you could sum two columns together)
3. Graphics: Please make sure to display at least one scatter plot, box plot and histogram. Don’t be limited to this. Please explore the many other options in R packages such as ggplot2.
4. Meaningful question for analysis: Please state at the beginning a meaningful question for analysis. Use the first three steps and anything else that would be helpful to answer the question you are posing from the data set you chose. Please write a brief conclusion paragraph in R markdown at the end.
5. BONUS – place the original .csv in a github file and have R read from the link. This will be a very useful skill as you progress in your data science education and career.

R Bridge Course Week 2 Assignment
One of the challenges in working with data is wrangling. In this assignment we will use R to perform this task.
Here is a list of data sets: http://vincentarelbundock.github.io/Rdatasets/ (click on the csv index for a list)
Please select one, download it and perform the following tasks:
1. Use the summary function to gain an overview of the data set. Then display the mean and median for at least two attributes of your data.
2. Create a new data frame with a subset of the columns AND rows. There are several ways to do this so feel free to try a couple if you want. Make sure to rename the new data set so it simply just doesn’t write it over.
3. Create new column names for each column in the new data frame created in step 2.
4. Use the summary function to create an overview of your new data frame created in step 2. The print the mean and median for the same two attributes. Please compare (i.e. tell me how the values changed and why).
5. For at least 3 different/distinct values in a column please rename so that every value in that column is renamed. For example, change the letter “e” to “excellent”, the letter “a” to “average’ and the word “bad” to “terrible”.
6. Display enough rows to see examples of all of steps 1-5 above. This means use a function to show me enough row values that I can see the changes.
7. BONUS – place the original .csv in a github file and have R read from the link. This should be your own github – not the file source. This will be a very useful skill as you progress in your data science education and career.

R Bridge Week 1 Assignment
R Bridge Week 1 Assignment
Please create the following exercises in .rmd format, publish to rpub and submit both the .rmd file and the rpub link. Full credit will only be given to those who publish their code AND ANSWERS to the run code on Rpubs. This will happen if you place your code in the grey chunks by starting with an .rmd file NOT a .R file
1. Write a loop that calculates 12-factorial
2. Show how to create a numeric vector that contains the sequence from 20 to 50 by 5.
3. Create the function “quad” that takes a trio of input numbers a, b, and c and solve the quadratic equation. The function should print as output the two solutions. Please run and test your answer for (1,2,1), (1,6,5) and (1,1,1).